Windows Prefetch: Tech Details of New Research in Section A & B

I wrote previously with an overview about the research into Windows prefetch I have been working on for years. This post will be getting more into the technical details of what I know to help others take the baton and get us all a better understanding of these files and the windows prefetch system.

I will be using my fork of the Windows-Prefetch-Parser to display the outputs in parsing this data. Some of the trace files I use below are public, but I didn’t have certain characteristics in my generated sample files to show all the scenarios.
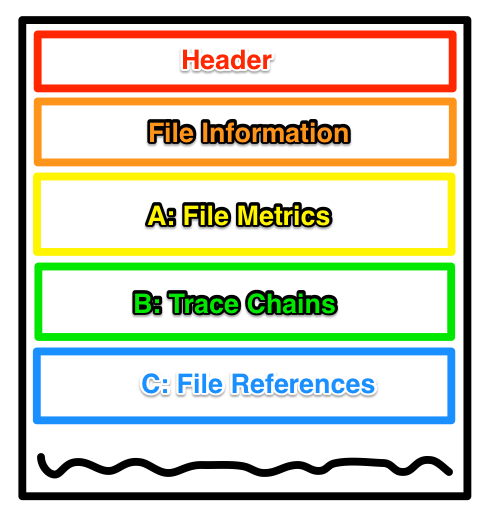
Section A Records

I will just start off with a table of properties for the section A records, referred to as the file metrics. The records are different sizes depending on the version. I have been working with the newer version (winVista+) and it has just a tad more info than the xp version.

Section A Version 17 format (4 byte records)

0 trace chain starting index id
4 total count of trace chains in section B
8 offset in section C to filename
12 number of characters in section C string
16 flags

Section A Version 23 format (4 byte records, except noted)

0 trace chain starting index id
4 total count of trace chains in section B
8 count of blocks that should be prefetched
12 offset in section C to filename
16 number of characters in section C string
20 flags
24 (6) $MFT record id
30 (2) $MFT record sequence update

As you can see between the tables, the records grew a bit starting with winVista to include a bit more data. The biggest difference is in the $MFT record references. Very handy to know the record number and the sequence update to be able to track down previous instances of files in $Log or $UsnJrnl records. The other added field is a count of blocks to be prefetched. There is a flag setting in the trace chain records that allows the program to specify if a block (or group) should be pulled fresh every time, somewhat like a web browser.

The flag values seem to be consistent between the two versions of files. This is an area that applies a general setting to all of the blocks (section B) loaded from the referenced file, but I have seen times where the blocks in section B were assigned a different flag value. Mostly, they line up. Here are the flag values

Flag values (integer bytes have been flipped from disk)
0x0200    X    blocks (section B) will be loaded into executable memory sections
0x0002    R    blocks (section B) will be loaded as resources, non-executable
0x0001    D    blocks should not be prefetched

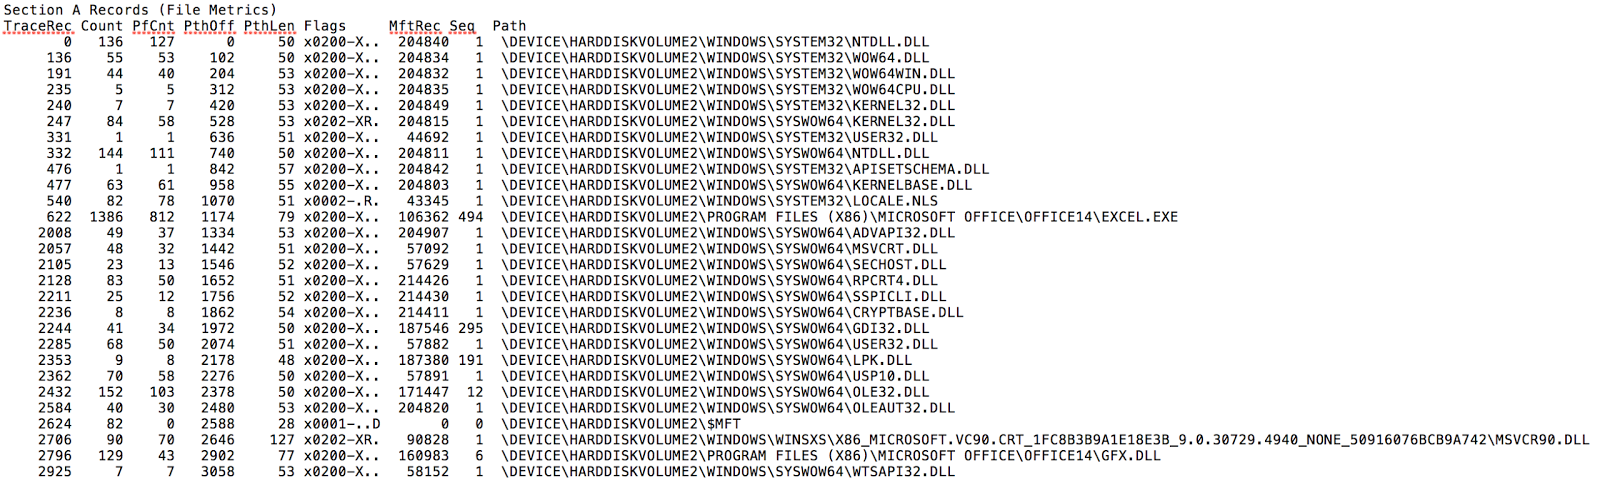
You can see these properties and the associated filenames in the output below. You will notice that the $MFT has been marked as one that shouldn’t be prefetched, which makes a lot of sense to not have stale data there. The other thing is that there are a couple DLL files that are referenced with XR because they are being requested to provide both executable code and non-executable resources.

Section B Records

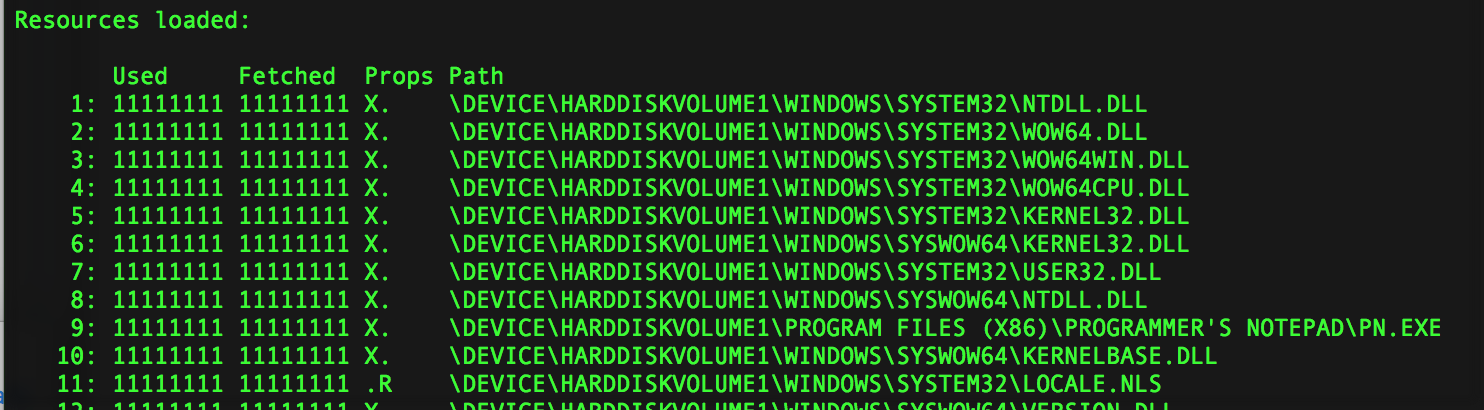
This section has records that are much smaller, but there is so much more going on. The most exciting part to me is the bitfields that show a record of usage over the last eight program runs. You have probably seen these bitfields printed next to the file resource list of the python output when running the tool, but that data is not associated with either the filename in section C or the file metrics records in section A. These bitfields are actually tracking each of the block clusters in section B, so the output is actually a calculated value combined from all associated section B records. I will get to that later. Let’s build that property offset table first. These records have stayed the same over all versions of prefetch so far.

Section B record format

0 (4) next trace record number (-1 if last block in chain)
4 (4) memory block offset
8 (1) Flags1
9 (1) Flags2
10 (1) usage bitfield
11 (1) prefetched bitfield

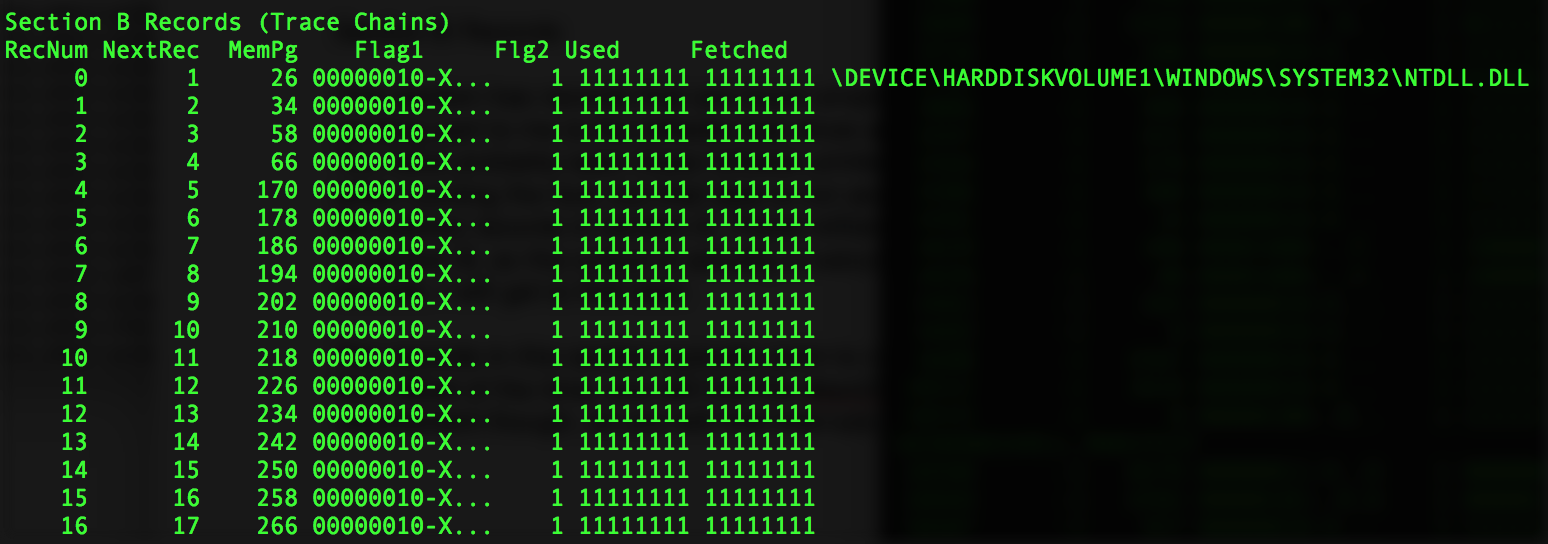
The records in this section typically point to clusters of 8 512 blocks that are loaded from the file on disk. Most of the time, you will find the block offset property walking up in values of 8. It isn’t a requirement though, so you will find intervals smaller than that as well.

Here is an example of these records walking by 8.

Here is an example of one record jumping in after 2.

Here is an example of a couple sequential records, jumping only by 1.

I broke the two flag fields up early on just to be able to determine what was going on with each of them. What I found out was that Flags2 is always a value of 1. I haven’t seen this change ever. Without a change, it is very difficult to determine the meaning of this value and field. I have kept it separate still because of the no change.

The Flags1 field is similar to the Flags field that is found in the section A records. It holds values for the same purposes (XRD), though the number values representing those properties aren’t necessarily the same. It also has a property that forces a block cluster to be prefetched as long as it has been used at least once in the last eight runs. I will get into more later about the patterns of prefetching that I have observed, but for now let’s build the table for the properties and their values.

0x02    X    blocks are loaded as executable
0x04    R    blocks are loaded as resources
0x08    F    blocks are forced to be prefetched
0x01    D    blocks will not be prefetched

Now I get to show my favorite part: the bitfields for usage and prefetch. They are each single byte values that hold eight slots in the form of bits. Every time the parent program executes, the bits are all shifted to the left. If this block cluster is used or fetched, the right most bit gets a 1; otherwise it remains 0. When a block cluster usage bitfield ends up with all 0, that block record is removed and the chain is resettled without it.

Imagine yourself sitting in front of a scrabble tile holder. It is has the capacity to hold only eight tiles, and it is currently filled with all 0 tiles. Each time the program runs and that block cluster is used, you put a 1 tile on from the right side. If the program runs and the block cluster is not used, then you place a 0 tile. Either way, you are going to push a tile off the left side because it doesn’t have enough room to hold that ninth tile. That tile is now gone and forgotten.

Prefetch Patterns

The patterns listed below occur in section B since this is where the two bitfields are housed. Remember that these are for block clusters and not for entire files. Here are some various scenarios around the patterns that I have seen. The assumption is neither the D or F property assigned unless specified. Also, none of these are guaranteed, just that I have observed them and noted the pattern at some point.

Block with the F (force prefetch) property assigned, after 1 use on 8th run:
10000000    11111111

Block with the D (don’t prefetch) property assigned, after a few uses:
01001011    00000000

Block that is generally used, but missed on one:
11011111    11111111

Block on first use:
00000001    00000000

Block on second run, single use:
00000010    00000001

Block on third run, single use:
00000100    00000011

Block on fourth run, single use:
00001000    00000110

Block used every other run:
01010101    00111111

Block used multiple times, then not:
01110000    00111111

Block used multiple times, but only one use showing:
10000000    11100000

More Work

I am excited to see what else can be learned about these files. My hope is that some of you take this data to test it and break it. You don’t have to be the best DFIR person out there to do that. All you need is that drive to learn.

James Habben
@JamesHabben Continue reading Windows Prefetch: Tech Details of New Research in Section A & B

Windows Prefetch: Overview of New Research in Sections A & B


The data stored in Prefetch trace files (those with a .pf extension) is a topic discussed quite a bit in digital forensics and incident response, and for good reason. It provides a great record of the executables that have been used, and Windows is configured to store them by default for workstation systems. In this article, I am going to add just a little bit more to the type of information that we can glean from one of these trace files.

File Format Review

The file format of Prefetch trace files has changed a bit over the years and those changes have generally included more information for us to take advantage of in our analysis. In Windows 10 for example, we were thrown a curve ball in that the prefetch trace files are now being stored compressed, for the most part.

The image below shows just the top portion of the trace files. The header and file information sections have been the recipient of the most version changes over the years. The sections following are labeled with letters as well as names according to Joachim’s document on the prefetch trace file format. The document does state that the name of section B is only based on what is known to this point, so it might change in the future. I hope that image isn’t too offensive. Drawing graphics is not a specialty of mine.

New Information, More Work

The information that I am writing about here is the result of many drawn out years and noncontiguous time of research. I have spent way too much time in IDA trying to analyze kernel level code (probably should just bite the bullet and learn WinDbg) and even more time watching patterns emerge as I stare deeply into the trace file contents. It is not fully baked, so I am hoping that what I explain here can lead to others, smarter than me, to run with this even further. I think there is more exciting things to be discovered still. I have added code to my fork of the windows-prefetch-parser python module, which I forked a while back to add SQLite output, and I will get a pull request into the main project in short time. This code adds just a bit of extra information in the standard display output, but there is also a -v option to get a full dump of the record parsing. (warning, lots of data)

File Usage – When

The first and major thing that I have determined is that we can get additional information about the files used (section C) in that we can specify which of the last 8 program executions took advantage of each file. We have to combine data from all three sections (A, B, and C) in order to get this more complete picture, something that the windows prefetcher refers to as a scenario. This can also help to explain why files can show up in trace files and randomly disappear some time later. Take a look at this image for a second.

This trace file is for Programmer’s Notepad (pn.exe) and was executed on a Windows 8 virtual machine. I created several small, unique text files to have distinct records for each program execution. I used the command line to execute pn.exe while passing it the name of each of those text files. I piped the output into grep to minimize the display data for easier understanding here.

There are two groups of 8 digits, and these are a bitfield. The left group represents the program triggering a page fault (soft or hard) to request data from the file. The right group represents the prefetcher doing a proactive grab of the data from that file, as this is the whole point to have data ready for the soft fault and to prevent the much more costly hard fault. In typical binary representation, a zero is false and a one is true. Each time the program is executed, these fields  are bitshifted to the left. This makes the right side the most recent execution and each column working left is the scenario prior, going up to eight total.

If you focus on an imaginary single file being used by an imaginary program, the bitfield would look like this over eight runs.
00000001
00000010
00000100
00001000
00010000
00100000
01000000
10000000

What happens after eight runs? I am glad you asked. If the value of this bitfield ends up being all zero’s, the file is removed from section C, and all associated records are removed from sections A and B. Interestingly, the file is not removed from the layout.ini file that sits beside all these trace files; not immediately, from what I have been able to determine.

If the file gets used again before that 1 gets pushed out, then the sections referencing that file will remain in the trace file.
00000001
00000010
00000100
00001000
00010001
00100010
01000100
10001000
00010000
00100001
01000010
10000100
00001000
etc.

File Usage – How

The second part, and the one that needs more research, is how this file was used by the executing program. There are some flag fields in both section A and B that provide a few values that have stuck out to me. There are other values that I have observed in these flag fields as well, but I have not been able to make a full determination about their designation yet.

The flag field that I have focused on is housed in section A. The three values that I have found purpose behind seem to represent 1) if a file was used to import executable code, 2) if the file was used just to reference some data, perhaps strings or constants, and 3) if the file was requested to not be prefetched. You will mostly see DLL files with the executable flag, although there are some that are referenced as a resource. You will find most of the other files being used as a resource.

In the output of windowsprefetch, I have indicated these properties as follows:
X    Executable code
R    Resource data
D    Don’t Prefetch

See some examples of these properties in the output below from pn.exe.

More Tech to Follow

I am going to stop this post here because I wanted this to be more of a higher level overview about the ways we can use these properties. I will be writing another blog post that gets into a little more gory detail of the records for those that might be interested.

Please help the community in this by testing the tool and the data that I am presenting here. Samples are in the GitHub repo. This has all been my own research, and we need to validate my findings or correct my mistakes. Take a few minutes to explore some of your system’s prefetch files.

You can comment below, DM me on twitter, or email me first@last.net if you have feedback. Thanks for reading!

James Habben
@JamesHabben Continue reading Windows Prefetch: Overview of New Research in Sections A & B


Triage Practical Solution – Malware Event – Prefetch $MFT IDS

You are staring at your computer screen thinking how you are going to tell your ISO what you found. Thinking about how this single IDS alert might have been overlooked; how it might have been lost among the sea of alerts from the various security products deployed in your company. Your ISO tasked with you triaging a malware event and now you are ready to report back.

Triage Scenario


To fill in those readers who may not know what is going on you started out the meeting providing background information about the event. The practical provided the following abbreviated scenario (for the full scenario refer to the post Triage Practical – Malware Event – Prefetch $MFT IDS):

The ISO continued “I directed junior security guy to look at the IDS alerts that came in over the weekend. He said something very suspicious occurred early Saturday morning on August 15, 2015.” Then the ISO looked directly at you “I need you to look into whatever this activity is and report back what you find.” “Also, make sure you document the process you use since we are going to use it as a playbook for these types of security incidents going forward.”

Below are some of the initial questions you need to answer and report back to the ISO.

        * Is this a confirmed malware security event or was the junior analyst mistaken?
        * What type of malware is involved?
        * What potential risk does the malware pose to your organization?
        * Based on the available information, what do you think occurred on the system to cause the malware event in the first place?


    Information Available


    Despite the wealth of information available to you within an enterprise, only a subset of data was provided for you to use while triaging this malware event. The following artifacts were made available:

            * IDS alerts for the time frame in question (you need to replay the provide pcap to generate the IDS alerts. pcap was not provided for you to use during triage and was only made available to enable you to generate the IDS alerts in question)


            * Prefetch files from the system in question (inside the Prefetch.ad1 file)

            * File system metadata from the system in question (the Master File Table is provided for this practical)

      Information Storage Location within an Enterprise


      Each enterprise’s network is different and each one offers different information for triaging. As such, it is not possible to outline all the possible locations where this information could be located in enterprises. However, it is possible to highlight common areas where this information can be found. To those reading this post whose environments do not reflect the locations I mention then you can evaluate your network environment for a similar system containing similar information or better prepare your network environment by making sure this information starts being collected in systems.

              * IDS alerts within an enterprise can be stored on the IDS/IPS sensors themselves or centrally located through a management console and/or logging system (i.e. SIEM)


              * Prefetch files within an enterprise can be located on the potentially infected system

              * File system metadata within an enterprise can be located on the potentially infected system

        Collecting the Information from the Storage Locations


        Knowing where information is available within an enterprise is only part of the equation. It is necessary to collect the information so it can be used for triaging. Similar to all the differences between enterprises’ networks, how information is collected varies from one organization to the next. Below are a few suggestions for how the information outlined above can be collected.

                * IDS alerts don’t have to be collected. They only need to be made available so they can be reviewed. Typically this is accomplished through a management console or security monitoring dashboard.


                * Prefetch files are stored on the potentially infected system. The collection of this artifact can be done by either pulling the files off remotely or locally. Remote options include an enterprise forensic tools such as F-Response, Encase Enterprise, or GRR Rapid Response, triage scripts such as Tr3Secure collection script, or by using the admin share since Prefetch files are not locked files. Local options can use the same options.

                * File system metadata is very similar to prefetch files because the same collection methods work for collecting it. The one exception is the NTFS Master File Table ($MFT) can’t be pulled off by using the admin share.

          Potential DFIR Tools to Use


          The last part of the equation is what tools one should use to examine the information that is collected. The tools I’m outlining below are the ones I used to complete the practical.

                Security Onion to generate the IDS alerts
                  * Winprefetchview to parse and examine the prefetch files
                  * MFT2CSV to parse and examine the $MFT file


            Others’ Approaches to Triaging the Malware Event


            Before I dive into how I triaged the malware event I wanted to share the approaches used by others to tackle the same malware event. I find it helpful to see different perspectives and techniques tried to solve the same issue. I also wanted to thank those who took the time to do this so others could benefit from what you share.

            Matt Gregory shared his analysis on his blog My Random Thoughts on InfoSec. Matt did a great job outlining not only what he found but by explaining how he did it and what tools he used. I highly recommend taking the time to read through his analysis and the thought process he used to approach this malware event.

            An anonymous person (at least anonymous to me since I couldn’t locate their name) posted their analysis on a newly created blog called Forensic Insights. Their post goes into detail on analyzing the packet capture including what was transmitted to the remote device.

            Partial Malware Event Triage Workflow


            The diagram below outlines the jIIr workflow for confirming malicious code events. The workflow is a modified version of the Securosis Malware Analysis Quant. I modified Securosis process to make it easier to use for security event analysis.


            Detection: the malicious code event is detected. Detection can be a result of technologies alerting on it or a person reporting it. The workflow starts in response to a potential event being detected and reported.

            Triage: the detected malicious code event is triaged to determine if it is a false positive or a real security event.

            Compromised: after the event is triaged the first decision point is to decide if the machine could potentially be compromised. If the event is a false positive or one showing the machine couldn’t be infected then the workflow is exited and returns back to monitoring the network. If the event is confirmed or there is a strong indication it is real then the workflow continues to identify the malware.

            Malware Identified: the malware is identified two ways. The first way is identifying what the malware is including its purpose and characteristics using available information. The second way is identifying and obtaining the malware sample from the actual system to further identify the malware and its characteristics.

            Root Cause Analysis: a quick root cause analysis is performed to determine how the machine was compromised and to identify indicators to use for scoping the incident. This root cause analysis does not call for a deep dive analysis taking hours and/or days but one only taking minutes.

            Quarantine: the machine is finally quarantined from the network it is connected to. This workflow takes into account performing analysis remotely so disconnecting the machine from the network is done at a later point in the workflow. If the machine is initially disconnected after detection then analysis cannot be performed until someone either physically visits the machine or ships the machine to you. If an organization’s security monitoring and incident response capability is not mature enough to perform root cause analysis in minutes and analysis live over the wire then the Quarantine activity should occur once the decision is made about the machine being compromised.

            Triage Analysis Solution


            To triage the malware event outlined in the scenario does not require one to use all of the supplied information. The triage process could had started with either the IDS alert the junior security analyst saw or the prefetch files from system in question to see what program executed early Saturday morning on August 15, 2015. For completeness, my analysis touches on each data source and the information it contains. As a result, I started with the IDS signature to ensure I included it in my analysis.

            IDS alerts


            The screenshot below shows the IDS signatures that triggered by replaying the provided malware-event.pcap file in Security Onion. I highlighted the alert of interest.


            The IDS alert by itself provides a wealth of information. The Emerging Threats (ET) signature that fired was “ET TROJAN HawkEye Keylogger FTP” and this occurred when the machine in question (192.168.200.128) made a connection to the IP address 107.180.21.230 on the FTP destination port 21. To determine if the alert is a false positive it’s necessary to explore the signature (if available) and the packet responsible for triggering it. The screenshot below shows the signature in question:


            The signature is looking for a system on the $HOME_NET going to an external system on the FTP port 21 and the system has to initiate the connection (as reflected by flow:established,to_server). The packet needs to contain the string “STOR HAWKEye_”. The packet that triggered this signature meets all of these requirements. The system connected to an external IP address on port 21 and the picture below shows the data in the packet contained the string of interest.


            Based on the network traffic and the packet data the IDS alert is not a false positive. I performed Internet research to obtain more context about the malware event. A simple Google search on HawkEye Keylogger produces numerous hits. From You Tube videos showing how to use it to forums posting cracked versions to various articles discussing it. One article is TrendMicro’s paper titled Piercing the HawkEye: Nigerian Cybercriminals Use a Simple Keylogger to Prey on SMBs Worldwide and just the pictures in the paper provide additional context (remember during triage you won’t have time to read 34 page paper.) The keylogger is easily customizable since it has a builder and it can delivery logs through SMTP or FTP. Additional functionality includes: stealing clipboard data, taking screenshots, downloading and executing other files, and collecting system information.

            Research on the destination IP address shows the AS is GODADDY and numerous domain names map back to the address.

            Prefetch files


            When I review programs executing on a system I tend to keep the high level indicators below in mind. Over the years, these indicators have enabled me to quickly identify malicious programs that are or were on a system.

            • Programs executing from temporary or cache folders
            • Programs executing from user profiles (AppData, Roaming, Local, etc)
            • Programs executing from C:\ProgramData or All Users profile
            • Programs executing from C:\RECYCLER
            • Programs stored as Alternate Data Streams (i.e. C:\Windows\System32:svchost.exe)
            • Programs with random and unusual file names
            • Windows programs located in wrong folders (i.e. C:\Windows\svchost.exe)
            • Other activity on the system around suspicious files


            The collected prefetch files were parsed with Winprefetchview and I initially sorted by process path. I reviewed the parsed prefetch files using my general indicators and I found the suspicious program highlighted in red.


            The program in question is suspicious for two reasons. First, the program executed from the temporarily Internet files folder. The second reason and more important one was the name of the program, which was OVERDUE INVOICE DOCUMENTS FOR PAYMENT 082015[1].EXE (%20 is the encoding for a space). The name resembles a program trying to be disguised as a document. This is a social engineering technique used with phishing emails. To gain more context around the suspicious program I then sorted by the Last Run time to see what else was executing around this time.


            The OVERDUE INVOICE DOCUMENTS FOR PAYMENT 082015[1].EXE program executed on 8/15/15 at 5:33:55 AM UTC, which matches up to the time frame the junior security analyst mentioned. The file had a MD5 hash of ea0995d9e52a436e80b9ad341ff4ee62. This hash was used to confirm the file was malicious as reflected in an available VirusTotal reportShortly thereafter another executable ran named VBC.exe but the process path was not reflected in the files referenced in the prefetch file itself. The other prefetch files did not show anything else I could easily tie to the malware event.

            File System Metadata


            At this point the IDS alert revealed the system in question had network activity related to the HawkEye Keylogger. The prefetch files revealed a suspicious program named OVERDUE INVOICE DOCUMENTS FOR PAYMENT 082015[1].EXE and it executed on 8/15/15 at 5:33:55 AM UTC. The next step in the triage process is to examine the file system metadata to identify any other malicious software on the system and to try to identify the initial infection vector. I reviewed the metadata in a timeline to make it easier to see the activity for the time of interest.

            For this practical I leveraged the MFT2CSV program in the configuration below to generate a timeline. However, an effective technique – but not free – is using the home plate feature in Encase Enterprise against a remote system. This enables you to see all files and folders while being able to sort different ways. The Encase Enterprise method is not as comprehensive as a $MFT timeline but works well for triaging.


            In the timeline I went to the time of interest, which was 8/15/15 at 5:33:55 AM UTC. I then proceeded forward in time to identify any other suspicious files. A few files were created within seconds of the OVERDUE INVOICE DOCUMENTS FOR PAYMENT 082015[1].EXE program executing. The files’ hashes will need to be used to determine more information about them since I am unable to view them.


            The timeline then shows the VBC.EXE program executing followed by activity associated with a user surfing the Internet.


            The timeline was reviewed for about a minute after the suspicious program executed and nothing else jumps out. The next step is go back to 8/15/15 at 5:33:55 AM UTC in the timeline to see what proceeded this event. There was more activity related to the user surfing the Internet as shown below.


            I kept working my way through the web browsing files to find something to confirm what the user was actually doing. I worked my way through Yahoo cookies and cache web pages containing the word “messages”. There was nothing definite so I continued going back in time. I worked my way back to around 5:30 AM UTC where cookies for Yahoo web mail were created. This activity was three minutes prior to the infection; three minutes is a long time. At this point additional information is needed to definitely answer how the system became infected in the first place. At least I know that it came from the Internet using a web browser. note: in the scenario the pcap file was meant for IDS alerts only so I couldn’t use it to answer the vector question.

            Researching Suspicious Files


            The analysis is not complete without researching the suspicious files discovered through triage. I performed additional research on the file OVERDUE INVOICE DOCUMENTS FOR PAYMENT 082015[1].EXE using its MD5 hash ea0995d9e52a436e80b9ad341ff4ee62. I went back to its VirusTotal report and noticed there didn’t appear to be a common name in the various security product detections. However, there were unique detection names I used to conduct additional research. Microsoft’s detection name was TrojanSpy:MSIL/Golroted.B and their report said the malware “tries to gather information stored on your PC”. A Google search of the hash also located a Malwr sandbox report for the file. The report didn’t shed any light on the other files I found in the timeline.

            The VBC.EXE file was no longer on the system preventing me from performing additional research on this file. The pid.txt and pidloc.txt files’ hashes were associated with a Hybrid Analysis report for a sample with the MD5 hash 242e9869ec694c6265afa533cfdf3e08. The report had a few interesting things. The sample also dropped the pid.txt and pidloc.txt files as well as executing the REGSVCS.EXE as a child process. This is the same behavior I saw in the file system metadata and prefetch files. The report provided a few other nuggets such as the sample tries to dump Web browser and Outlook stored passwords.

            Triage Analysis Wrap-up


            The triage process did confirm the system was infected with malicious code. The infection was a result of the user doing something on the Internet and additional information is needed to confirm what occurred on the system for it to become infected in the first place. The risk to the organization is the malicious code tries to capture and exfiltrate information from the system including passwords. The next step would be to escalate the malware event to the incident response process so a deeper analysis can be done to answer more questions. Questions such as what data was potentially exposed, what did the user do to contribute to the infection, was the attack random or targeted, and what type of response should be done.

            Continue reading Triage Practical Solution – Malware Event – Prefetch $MFT IDS

            Triage Practical Solution – Malware Event – Prefetch $MFT IDS

            You are staring at your computer screen thinking how you are going to tell your ISO what you found. Thinking about how this single IDS alert might have been overlooked; how it might have been lost among the sea of alerts from the various security products deployed in your company. Your ISO tasked with you triaging a malware event and now you are ready to report back.

            Triage Scenario


            To fill in those readers who may not know what is going on you started out the meeting providing background information about the event. The practical provided the following abbreviated scenario (for the full scenario refer to the post Triage Practical – Malware Event – Prefetch $MFT IDS):

            The ISO continued “I directed junior security guy to look at the IDS alerts that came in over the weekend. He said something very suspicious occurred early Saturday morning on August 15, 2015.” Then the ISO looked directly at you “I need you to look into whatever this activity is and report back what you find.” “Also, make sure you document the process you use since we are going to use it as a playbook for these types of security incidents going forward.”

            Below are some of the initial questions you need to answer and report back to the ISO.

                    * Is this a confirmed malware security event or was the junior analyst mistaken?
                    * What type of malware is involved?
                    * What potential risk does the malware pose to your organization?
                    * Based on the available information, what do you think occurred on the system to cause the malware event in the first place?


              Information Available


              Despite the wealth of information available to you within an enterprise, only a subset of data was provided for you to use while triaging this malware event. The following artifacts were made available:

                      * IDS alerts for the time frame in question (you need to replay the provide pcap to generate the IDS alerts. pcap was not provided for you to use during triage and was only made available to enable you to generate the IDS alerts in question)


                      * Prefetch files from the system in question (inside the Prefetch.ad1 file)

                      * File system metadata from the system in question (the Master File Table is provided for this practical)

                Information Storage Location within an Enterprise


                Each enterprise’s network is different and each one offers different information for triaging. As such, it is not possible to outline all the possible locations where this information could be located in enterprises. However, it is possible to highlight common areas where this information can be found. To those reading this post whose environments do not reflect the locations I mention then you can evaluate your network environment for a similar system containing similar information or better prepare your network environment by making sure this information starts being collected in systems.

                        * IDS alerts within an enterprise can be stored on the IDS/IPS sensors themselves or centrally located through a management console and/or logging system (i.e. SIEM)


                        * Prefetch files within an enterprise can be located on the potentially infected system

                        * File system metadata within an enterprise can be located on the potentially infected system

                  Collecting the Information from the Storage Locations


                  Knowing where information is available within an enterprise is only part of the equation. It is necessary to collect the information so it can be used for triaging. Similar to all the differences between enterprises’ networks, how information is collected varies from one organization to the next. Below are a few suggestions for how the information outlined above can be collected.

                          * IDS alerts don’t have to be collected. They only need to be made available so they can be reviewed. Typically this is accomplished through a management console or security monitoring dashboard.


                          * Prefetch files are stored on the potentially infected system. The collection of this artifact can be done by either pulling the files off remotely or locally. Remote options include an enterprise forensic tools such as F-Response, Encase Enterprise, or GRR Rapid Response, triage scripts such as Tr3Secure collection script, or by using the admin share since Prefetch files are not locked files. Local options can use the same options.

                          * File system metadata is very similar to prefetch files because the same collection methods work for collecting it. The one exception is the NTFS Master File Table ($MFT) can’t be pulled off by using the admin share.

                    Potential DFIR Tools to Use


                    The last part of the equation is what tools one should use to examine the information that is collected. The tools I’m outlining below are the ones I used to complete the practical.

                          Security Onion to generate the IDS alerts
                            * Winprefetchview to parse and examine the prefetch files
                            * MFT2CSV to parse and examine the $MFT file


                      Others’ Approaches to Triaging the Malware Event


                      Before I dive into how I triaged the malware event I wanted to share the approaches used by others to tackle the same malware event. I find it helpful to see different perspectives and techniques tried to solve the same issue. I also wanted to thank those who took the time to do this so others could benefit from what you share.

                      Matt Gregory shared his analysis on his blog My Random Thoughts on InfoSec. Matt did a great job outlining not only what he found but by explaining how he did it and what tools he used. I highly recommend taking the time to read through his analysis and the thought process he used to approach this malware event.

                      An anonymous person (at least anonymous to me since I couldn’t locate their name) posted their analysis on a newly created blog called Forensic Insights. Their post goes into detail on analyzing the packet capture including what was transmitted to the remote device.

                      Partial Malware Event Triage Workflow


                      The diagram below outlines the jIIr workflow for confirming malicious code events. The workflow is a modified version of the Securosis Malware Analysis Quant. I modified Securosis process to make it easier to use for security event analysis.


                      Detection: the malicious code event is detected. Detection can be a result of technologies alerting on it or a person reporting it. The workflow starts in response to a potential event being detected and reported.

                      Triage: the detected malicious code event is triaged to determine if it is a false positive or a real security event.

                      Compromised: after the event is triaged the first decision point is to decide if the machine could potentially be compromised. If the event is a false positive or one showing the machine couldn’t be infected then the workflow is exited and returns back to monitoring the network. If the event is confirmed or there is a strong indication it is real then the workflow continues to identify the malware.

                      Malware Identified: the malware is identified two ways. The first way is identifying what the malware is including its purpose and characteristics using available information. The second way is identifying and obtaining the malware sample from the actual system to further identify the malware and its characteristics.

                      Root Cause Analysis: a quick root cause analysis is performed to determine how the machine was compromised and to identify indicators to use for scoping the incident. This root cause analysis does not call for a deep dive analysis taking hours and/or days but one only taking minutes.

                      Quarantine: the machine is finally quarantined from the network it is connected to. This workflow takes into account performing analysis remotely so disconnecting the machine from the network is done at a later point in the workflow. If the machine is initially disconnected after detection then analysis cannot be performed until someone either physically visits the machine or ships the machine to you. If an organization’s security monitoring and incident response capability is not mature enough to perform root cause analysis in minutes and analysis live over the wire then the Quarantine activity should occur once the decision is made about the machine being compromised.

                      Triage Analysis Solution


                      To triage the malware event outlined in the scenario does not require one to use all of the supplied information. The triage process could had started with either the IDS alert the junior security analyst saw or the prefetch files from system in question to see what program executed early Saturday morning on August 15, 2015. For completeness, my analysis touches on each data source and the information it contains. As a result, I started with the IDS signature to ensure I included it in my analysis.

                      IDS alerts


                      The screenshot below shows the IDS signatures that triggered by replaying the provided malware-event.pcap file in Security Onion. I highlighted the alert of interest.


                      The IDS alert by itself provides a wealth of information. The Emerging Threats (ET) signature that fired was “ET TROJAN HawkEye Keylogger FTP” and this occurred when the machine in question (192.168.200.128) made a connection to the IP address 107.180.21.230 on the FTP destination port 21. To determine if the alert is a false positive it’s necessary to explore the signature (if available) and the packet responsible for triggering it. The screenshot below shows the signature in question:


                      The signature is looking for a system on the $HOME_NET going to an external system on the FTP port 21 and the system has to initiate the connection (as reflected by flow:established,to_server). The packet needs to contain the string “STOR HAWKEye_”. The packet that triggered this signature meets all of these requirements. The system connected to an external IP address on port 21 and the picture below shows the data in the packet contained the string of interest.


                      Based on the network traffic and the packet data the IDS alert is not a false positive. I performed Internet research to obtain more context about the malware event. A simple Google search on HawkEye Keylogger produces numerous hits. From You Tube videos showing how to use it to forums posting cracked versions to various articles discussing it. One article is TrendMicro’s paper titled Piercing the HawkEye: Nigerian Cybercriminals Use a Simple Keylogger to Prey on SMBs Worldwide and just the pictures in the paper provide additional context (remember during triage you won’t have time to read 34 page paper.) The keylogger is easily customizable since it has a builder and it can delivery logs through SMTP or FTP. Additional functionality includes: stealing clipboard data, taking screenshots, downloading and executing other files, and collecting system information.

                      Research on the destination IP address shows the AS is GODADDY and numerous domain names map back to the address.

                      Prefetch files


                      When I review programs executing on a system I tend to keep the high level indicators below in mind. Over the years, these indicators have enabled me to quickly identify malicious programs that are or were on a system.

                      • Programs executing from temporary or cache folders
                      • Programs executing from user profiles (AppData, Roaming, Local, etc)
                      • Programs executing from C:\ProgramData or All Users profile
                      • Programs executing from C:\RECYCLER
                      • Programs stored as Alternate Data Streams (i.e. C:\Windows\System32:svchost.exe)
                      • Programs with random and unusual file names
                      • Windows programs located in wrong folders (i.e. C:\Windows\svchost.exe)
                      • Other activity on the system around suspicious files


                      The collected prefetch files were parsed with Winprefetchview and I initially sorted by process path. I reviewed the parsed prefetch files using my general indicators and I found the suspicious program highlighted in red.


                      The program in question is suspicious for two reasons. First, the program executed from the temporarily Internet files folder. The second reason and more important one was the name of the program, which was OVERDUE INVOICE DOCUMENTS FOR PAYMENT 082015[1].EXE (%20 is the encoding for a space). The name resembles a program trying to be disguised as a document. This is a social engineering technique used with phishing emails. To gain more context around the suspicious program I then sorted by the Last Run time to see what else was executing around this time.


                      The OVERDUE INVOICE DOCUMENTS FOR PAYMENT 082015[1].EXE program executed on 8/15/15 at 5:33:55 AM UTC, which matches up to the time frame the junior security analyst mentioned. The file had a MD5 hash of ea0995d9e52a436e80b9ad341ff4ee62. This hash was used to confirm the file was malicious as reflected in an available VirusTotal reportShortly thereafter another executable ran named VBC.exe but the process path was not reflected in the files referenced in the prefetch file itself. The other prefetch files did not show anything else I could easily tie to the malware event.

                      File System Metadata


                      At this point the IDS alert revealed the system in question had network activity related to the HawkEye Keylogger. The prefetch files revealed a suspicious program named OVERDUE INVOICE DOCUMENTS FOR PAYMENT 082015[1].EXE and it executed on 8/15/15 at 5:33:55 AM UTC. The next step in the triage process is to examine the file system metadata to identify any other malicious software on the system and to try to identify the initial infection vector. I reviewed the metadata in a timeline to make it easier to see the activity for the time of interest.

                      For this practical I leveraged the MFT2CSV program in the configuration below to generate a timeline. However, an effective technique – but not free – is using the home plate feature in Encase Enterprise against a remote system. This enables you to see all files and folders while being able to sort different ways. The Encase Enterprise method is not as comprehensive as a $MFT timeline but works well for triaging.


                      In the timeline I went to the time of interest, which was 8/15/15 at 5:33:55 AM UTC. I then proceeded forward in time to identify any other suspicious files. A few files were created within seconds of the OVERDUE INVOICE DOCUMENTS FOR PAYMENT 082015[1].EXE program executing. The files’ hashes will need to be used to determine more information about them since I am unable to view them.


                      The timeline then shows the VBC.EXE program executing followed by activity associated with a user surfing the Internet.


                      The timeline was reviewed for about a minute after the suspicious program executed and nothing else jumps out. The next step is go back to 8/15/15 at 5:33:55 AM UTC in the timeline to see what proceeded this event. There was more activity related to the user surfing the Internet as shown below.


                      I kept working my way through the web browsing files to find something to confirm what the user was actually doing. I worked my way through Yahoo cookies and cache web pages containing the word “messages”. There was nothing definite so I continued going back in time. I worked my way back to around 5:30 AM UTC where cookies for Yahoo web mail were created. This activity was three minutes prior to the infection; three minutes is a long time. At this point additional information is needed to definitely answer how the system became infected in the first place. At least I know that it came from the Internet using a web browser. note: in the scenario the pcap file was meant for IDS alerts only so I couldn’t use it to answer the vector question.

                      Researching Suspicious Files


                      The analysis is not complete without researching the suspicious files discovered through triage. I performed additional research on the file OVERDUE INVOICE DOCUMENTS FOR PAYMENT 082015[1].EXE using its MD5 hash ea0995d9e52a436e80b9ad341ff4ee62. I went back to its VirusTotal report and noticed there didn’t appear to be a common name in the various security product detections. However, there were unique detection names I used to conduct additional research. Microsoft’s detection name was TrojanSpy:MSIL/Golroted.B and their report said the malware “tries to gather information stored on your PC”. A Google search of the hash also located a Malwr sandbox report for the file. The report didn’t shed any light on the other files I found in the timeline.

                      The VBC.EXE file was no longer on the system preventing me from performing additional research on this file. The pid.txt and pidloc.txt files’ hashes were associated with a Hybrid Analysis report for a sample with the MD5 hash 242e9869ec694c6265afa533cfdf3e08. The report had a few interesting things. The sample also dropped the pid.txt and pidloc.txt files as well as executing the REGSVCS.EXE as a child process. This is the same behavior I saw in the file system metadata and prefetch files. The report provided a few other nuggets such as the sample tries to dump Web browser and Outlook stored passwords.

                      Triage Analysis Wrap-up


                      The triage process did confirm the system was infected with malicious code. The infection was a result of the user doing something on the Internet and additional information is needed to confirm what occurred on the system for it to become infected in the first place. The risk to the organization is the malicious code tries to capture and exfiltrate information from the system including passwords. The next step would be to escalate the malware event to the incident response process so a deeper analysis can be done to answer more questions. Questions such as what data was potentially exposed, what did the user do to contribute to the infection, was the attack random or targeted, and what type of response should be done.

                      Continue reading Triage Practical Solution – Malware Event – Prefetch $MFT IDS

                      Triaging a System Infected with Poweliks

                      Change is one of the only constants in incident response. In time most things will change; technology, tools, processes, and techniques all eventually change. The change is not only limited to the things we rely on to be the last line of defense for our organizations and/or customers. The threats we are protecting them against change too. One recent example is the Angler exploit kit incorporating fileless malware. Malware that never hits the hard drive is not new but this change is pretty significant. An exploit kit is using the technique so the impact is more far reaching than the previous instances where fileless malware has been used (to my knowledge.) In this post I’m walking through the process one can use to triage a system potentially impacted by fileless malware. The post is focused on Poweliks but the process applies to any fileless malware.

                      Background on Why This Matters


                      In my RSS feeds, I was following the various articles about how an exploit kit incorporated the use of fileless malware. The malware never gets dropped to the disk and gets loaded directly into memory. A few of the articles I’m referring to are: Poweliks: The file-less little malware that could, Angler EK : now capable of “fileless” infection (memory malware), Fileless Infections from Exploit Kit: An Overview, POWELIKS: Malware Hides In Windows Registry, and POWELIKS Levels Up With New Autostart Mechanism. Reading the articles made one thing clear: one of the most effective tools to deliver malware (exploit kits) is now using malware that stays in memory.

                      This change has a significant impact on multiple areas. If the malware stays in memory then the typically artifacts we see on the host will not be there. For example, when the malware is loaded into memory then it won’t create program execution artifacts on the system. This means the triage and examination process needs to adjust. As I mentioned previously, this change was implemented into a widely known exploit kit (Angler exploit kit.) The systems infected with this exploit kit can be far reaching. This means we will encounter this change sooner rather than later; if you haven’t faced it already. Case in point, recently the Internet Systems Consortium website was compromised and was redirecting visitors to the Angler exploit kit. The last impact is if this change provides better results for the people behind it then I can see other exploit kit authors following suit. This means fileless malware may become even more widespread and it’s something that is here to stay.

                      I knew memory forensics is one technique we can use to find the malware in memory. (if you need a great reference on how to do this check out the book the Art of Memory Forensics.) However, the question remained what does this look like. I took the short route for a quick answer to my question by reaching out to my Twitter followers. I asked them the following: “Anyone know how Poweliks code looks from memory forensics perspective?”

                      The first responses I got back was from Adam over at the Hexacron blog (great blog by the way) as shown below.


                      Adam provided some great information; to narrow in on the dllhost.exe process and what strings to look for. Another response I got was from @lstaPee as shown below:

                      @lstaPee provided a few more tidbits. RunDll32.exe injects code into the Dllhost.exe and dllhost.exe should have network connections. The response I got back from Twitter was great but I really needed to address the bigger question. If and when I have to triage a system infected with Poweliks what is the fastest way to perform the triage to locate the malware and determine the root cause of the infection. A question I needed to dig in to in order to find out the answer.

                      Testing Environment


                      As much as I wanted to simulate this attack by finding a live link to an Angler exploit kit I knew it would be very difficult. Based on various articles I read, Angler is VMware aware and  it doesn’t always deliverer the fileless malware. I opted to use a Powelik’s dropper/downloader. I used the sample MD5 0181850239cd26b8fb8b72afb0e95eac I found on Malwr. The test system was a Windows 7 32bit virtual machine in VMware.

                      The test conditions were really basic. I executed the sample by clicking it and then waited for about a minute. The VM was suspended and I collected the memory and prefetch files. I then unsuspended the VM followed by rebooting the system. After reboot, I logged onto the VM and then suspended it to collect the memory and prefetch files.

                      My tests was to analyze the Poweliks infection from two angles. The initial infection prior to a system reboot and a persistent infection after the system reboots. My analysis had one exception. By clicking the Poweliks executable to infect the system this action created program execution artifacts. I ignored these artifacts since they wouldn’t be present if the malware was loaded directly into memory. I followed my typical examination process on the memory images and vmdk files but this post only highlights the activity that directly points to Poweliks. There was other activity of interest but the activity by itself does not indicate anything malicious. This activity I opted to omit from the post.

                      Poweliks’ Behavior


                      Before diving into the triage process and what to look for it’s important I discuss one Poweliks’ behavior. I won’t go into any details how I first picked up on this but I will show the end result. What the behavior is and how it can help when triaging Poweliks specifically. The screenshot below shows partial of the Malwr’s behavior analysis section showing the behavior I’m referring to.


                      Upon a system’s initial infection, the malware calls rundll32.exe which then calls powershell.exe who injects code into the dllhost.exe process. In the image above the numbers are for the process IDs and this relevant as we dig deeper into the behavior.

                      The image below shows activity that occurs shortly after the rundll32.exe process starts. As can be seen, rundll32.exe attempts to load a module into its own address space with the LdrLoadDll function. The module being loaded is actually javascript; this behavior is well documented for Poweliks such as in the article Poweliks – Command Line Confusion. Notice the activity following the LdrLoadDll function call is trying to locate the address for the RunHTMLApplication function. Here’s the keyword Adam pointed out.

                      The images below shows activity that occurs just prior to powershell.exe process exiting. Powershell.exe creates the dllhost.exe process in the suspended state. Code gets injected into this suspended dllhost.exe process and then it is resumed. This technique is process hollowing and when the suspended process is resumed it executes the injected code.

                      Triaging System Infected with Poweliks


                      Triage is the assessment of a security event to determine if there is a security incident, its priority, and the need for escalation. As it relates to potential malware incidents, the purpose of triaging may vary. In this instance, triage is being used to determine if an event is a security incident or false positive by identifying  malware on the system. Confirming the presence of malware allows for a deeper examination to be completed. The triage process I’m outlining is to confirm the presence of the Poweliks fileless malware.

                      Triaging with Host Artifacts


                      Normally, triaging a system using artifacts on the host is an effective technique to identify malware. This is especially true when leveraging program execution artifacts. However, loading malware directly into memory has a significant impact on the artifacts available on the host. There are very little artifacts available and if the malware doesn’t remain persistent then there will be even less. Triaging a system infected with Poweliks is no different. Most of the typically artifacts are missing but it can still be identified using prefetch files and autorun locations.

                      Prefetch Files

                      Previously I outlined the Poweliks behavior where the rundll32.exe process runs, which then starts a powershell.exe process before injecting code into the dllhost.exe suspended process. This behavior is apparent in the prefetch files at the point of the initial infection. The image below shows the activity.


                      The prefetch files show the sequence of rundll32.exe executing followed by powershell.exe before dllhost.exe. Furthermore, the dllhost.exe prefetch file is missing the process path. The missing process path indicates process hollowing was used as I outlined in the post Prefetch File Meet Process Hollowing. The prefetch files contain references to files accessed during the first 10 seconds of application startup. The dllhost.exe prefetch file contains revealing ones. It contains a reference to wininet.dll for interacting with the network and files associated with Internet Explorer as shown below.

                      This specific prefetch file sequence only occurs upon the initial infection. Future system restarts where Poweliks is loaded into the dllhost.exe process only shows the dllhost.exe prefetch file. The file references in this prefetch still show references to files located in the user profile.

                      Autoruns


                      The prefetch files contain a distinctive pattern indicating a Poweliks infection. Depending on the sample, autoruns can reveal even more. I mention depending on the sample because Poweliks has changed its persistence mechanism. Initially it used the Run registry key before moving on to a CLSID registry key. I thought one article mentioned Poweliks may not try to remain persistent at all times. If Poweliks does try to remain persistent then its mechanism can be used to find it. Keep in mind, Poweliks has taken self protection measures to prevent this mechanism from being located on a live system. The easiest method to bypass these measures is to access the system remotely with a forensic tool like Encase Enterprise, mount the drive, and then run Regripper across the hives.

                      The image below shows the Run key from the user account on my test system. The sample I used was older since the Run key was used but it still is a tell-tale sign for a Poweliks infection.

                      …snip….

                      Memory Analysis Triage


                      Fileless malware may leave very little artifacts available on the host’s hard drive but it still has to reside in memory. The most effective technique to identify a fileless malware infection is memory forensics. A Poweliks infection is not an exception since it stands out in memory whether if the memory is examined after the initial infection or a system reboot.

                      Network Connections


                      One area with malware indications is network activity are for unusual processes. @lstaPee alluded to this in their tweet about Poweliks. The Volatility netscan plug-in does show network activity for  the dllhost.exe process involving the IP address 178.89.159.35 on port 80 for HTTP traffic. dllhost.exe is not a process typically associated with web traffic so this makes it a good indicator pointing to Poweliks.

                      Process Listing


                      Another area with malware indications is the process listing showing unusual ones or ones with unusual commands. The Volatility pslist, psscan, and pstree -v plugins did not reveal anything that could definitely be used as an indicator but they did show the dllhost.exe process running. I checked a few clean systems to see if dllhost.exe normally runs but the process was not running by default.  This doesn’t mean it can be used as an indicator because there could be other reasons for dllhost.exe running besides Poweliks. The screen below is from the pstree plug-in showing the command-line for launching dllhost.exe (notice there are no other options used in the command.)

                      Injected Code


                      Looking for processes with injected code is an effective technique to locate malware on a system. This is the one technique that absolutely reveals Poweliks on a system. The Volatility malfind plug-in showed the dllhost.exe process with injected code. This matches up to the articles about the malware and behavior analysis showing code does get injected into the dllhost.exe process. The image below shows the partial output from malfind.


                      Extracting the injected code and scanning it with antivirus confirms it is Poweliks. The image below shows the VirusTotal results for the injected code. Microsoft detected the code as Trojan:Win32/Powessere.A which is their classification for Poweliks.

                      Strings


                      The last area containing indicators pointing to Poweliks are the strings in the dllhost.exe process. The method to review the strings is not as straight forward as running a single Volatility plug-in. The strings command reference walks through the process and it’s the one I used. The only thing I did different was to grep for my process ID to make the strings easier to review. The dllhost.exe strings revealed URLs such as one containing the IP address found with the netscan plug-in.

                      The most significant string found was the command used to make rundll32.exe inject code into the dllhost.exe process as shown below. The presence of this string alone in the dllhost.exe process indicates the system is infected with Poweliks.

                      Wrapping Things Up


                      The change introduce by the Angler exploit kit creator(s) is causing us to make adjustments in our processes. The effective techniques we used in the past may not be as effective against fileless malware. However, it doesn’t mean nothing is effective preventing us from triaging these systems. It only means we need to use other processes, techniques, and tools we have at our disposal. We need to take what artifacts do remain and use it to our advantage. This post was specific to the Poweliks malware but the techniques discussed will apply to other fileless malware. The only difference will be what data is actually found in the artifacts. Continue reading Triaging a System Infected with Poweliks