Toolsmith #125: ZAPR – OWASP ZAP API R Interface

It is my sincere hope that when I say OWASP Zed Attack Proxy (ZAP), you say “Hell, yeah!” rather than “What’s that?”. This publication has been a longtime supporter, and so many brilliant contibutors and practitioners have lent to OWASP ZAPs growth, in… Continue reading Toolsmith #125: ZAPR – OWASP ZAP API R Interface

toolsmith #116: vFeed & vFeed Viewer

Overview

In case you haven’t guessed by now, I am an unadulterated tools nerd. Hopefully, ten years of toolsmith have helped you come to that conclusion on your own. I rejoice when I find like-minded souls, I found one in Nabil (NJ) Ouchn (@toolswatch), he of Black Hat Arsenal and toolswatch.org fame. In addition to those valued and well-executed community services, NJ also spends a good deal of time developing and maintaining vFeed. vFeed included a Python API and the vFeed SQLite database, now with support for Mongo. It is, for all intents and purposes a correlated community vulnerability and threat database. I’ve been using vFeed for quite a while now having learned about it when writing about FruityWifi a couple of years ago.
NJ fed me some great updates on this constantly maturing product.
Having achieved compatibility certifications (CVE, CWE and OVAL) from MITRE, the vFeed Framework (API and Database) has started to gain more than a little gratitude from the information security community and users, CERTs and penetration testers. NJ draws strength from this to add more features now and in the future. The actual vFeed roadmap is huge. It varies from adding new sources such as security advisories from industrial control system (ICS) vendors, to supporting other standards such as STIX, to importing/enriching scan results from 3rd party vulnerability and threat scanners such as Nessus, Qualys, and OpenVAS.
There have a number of articles highlighting impressive vFeed uses cases of vFeed such as:

Needless to say, some fellow security hackers and developers have included vFeed in their toolkit, including Faraday (March 2015 toolsmith), Kali Linux, and more (FruityWifi as mentioned above).

The upcoming version vFeed will introduce support for CPE 2.3, CVSS 3, and new reference sources. A proof of concept to access the vFeed database via a RESTFul API is in testing as well. NJ is fine-tuning his Flask skills before releasing it. 🙂 NJ, does not consider himself a Python programmer and considers himself unskilled (humble but unwarranted). Luckily Python is the ideal programming language for someone like him to express his creativity.
I’ll show you all about woeful programming here in a bit when we discuss the vFeed Viewer I’ve written in R.

First, a bit more about vFeed, from its Github page:
The vFeed Framework is CVE, CWE and OVAL compatible and provides structured, detailed third-party references and technical details for CVE entries via an extensible XML/JSON schema. It also improves the reliability of CVEs by providing a flexible and comprehensive vocabulary for describing the relationship with other standards and security references.
vFeed utilizes XML-based and  JSON-based formatted output to describe vulnerabilities in detail. This output can be leveraged as input by security researchers, practitioners and tools as part of their vulnerability analysis practice in a standard syntax easily interpreted by both human and machine.
The associated vFeed.db (The Correlated Vulnerability and Threat Database) is a detective and preventive security information repository useful for gathering vulnerability and mitigation data from scattered internet sources into an unified database.
vFeed’s documentation is now well populated in its Github wiki, and should be read in its entirety:

  1. vFeed Framework (API & Correlated Vulnerability Database)
  2. Usage (API and Command Line)
  3. Methods list
  4. vFeed Database Update Calendar

vFeed features include:

  • Easy integration within security labs and other pentesting frameworks 
  • Easily invoked via API calls from your software, scripts or from command-line. A proof of concept python api_calls.py is provided for this purpose
  • Simplify the extraction of related CVE attributes
  • Enable researchers to conduct vulnerability surveys (tracking vulnerability trends regarding a specific CPE)
  • Help penetration testers analyze CVEs and gather extra metadata to help shape attack vectors to exploit vulnerabilities
  • Assist security auditors in reporting accurate information about findings during assignments. vFeed is useful in describing a vulnerability with attributes based on standards and third-party references(vendors or companies involved in the standardization effort)
vFeed installation and usage
Installing vFeed is easy, just download the ZIP archive from Github and unpack it in your preferred directory or, assuming you’ve got Git installed, run git clone https://github.com/toolswatch/vFeed.git
You’ll need a Python interpreter installed, the latest instance of 2.7 is preferred. From the directory in which you installed vFeed, just run python vfeedcli.py -h followed by python vfeedcli.py -u to confirm all is updated and in good working order; you’re ready to roll.
You’ve now read section 2 (Usage) on the wiki, so you don’t need a total usage rehash here. We’ll instead walk through a few options with one of my favorite CVEs: CVE-2008-0793.
If we invoke python vfeedcli.py -m get_cve CVE-2008-0793, we immediately learn that it refers to a Tendenci CMS cross-site scripting vulnerability. The -m parameter lets you define the preferred method, in this case, get_cve.
Groovy, is there an associated CWE for CVE-2008-0793? But of course. Using the get_cwe method we learn that CWE-79 or “Improper Neutralization of Input During Web Page Generation (‘Cross-site Scripting’)” is our match.
If you want to quickly learn all the available methods, just run python vfeedcli.py –list.
Perhaps you’d like to determine what the CVSS score is, or what references are available, via the vFeed API? Easy, if you run…
from lib.core.methods.risk import CveRisk
cve = “CVE-2014-0160”
cvss = CveRisk(cve).get_cvss()
print cvss
You’ll retrieve…
For reference material…
from lib.core.methods.ref import CveRef
cve = “CVE-2008-0793”
ref = CveRef(cve).get_refs()
print ref

Yields…
And now you know…the rest of the story. CVE-2008-0793 is one of my favorites because a) I discovered it, and b) the vendor was one of the best of many hundreds I’ve worked with to fix vulnerabilities.
vFeed Viewer
If NJ thinks his Python skills are rough, wait until he sees this. 🙂
I thought I’d get started on a user interface for vFeed using R and Shiny, appropriately name vFeed Viewer and found on Github here. This first version does not allow direct queries of the vFeed database as I’m working on SQL injection prevention, but it does allow very granular filtering of key vFeed tables. Once I work out safe queries and sanitization, I’ll build the same full correlation features you enjoy from NJ’s Python vFeed client.
You’ll need a bit of familiarity with R to make use of this viewer.
First install R, and RStudio.  From the RStudio console, to ensure all dependencies are met, run install.packages(c(“shinydashboard”,”RSQLite”,”ggplot2″,”reshape2″)).
Download and install the vFeed Viewer in the root vFeed directory such that app.R and the www directory are side by side with vfeedcli.py, etc. This ensures that it can read vfeed.db as the viewer calls it directly with dbConnect and dbReadTable, part of the RSQLite package.
Open app.R with RStudio then, click the Run App button. Alternatively, from the command-line, assuming R is in your path, you can run R -e “shiny::runApp(‘~/shinyapp’)” where ~/shinyapp is the path to where app.R resides. In my case, on Windows, I ran R -e “shiny::runApp(‘c:\\tools\\vfeed\\app.R’)”. Then browser to the localhost address Shiny is listening on. You’ll probably find the RStudio process easier and faster.
One important note about R, it’s not known for performance, and this app takes about thirty seconds to load. If you use Microsoft (Revolution) R with the MKL library, you can take advantage of multiple cores, but be patient, it all runs in memory. Its fast as heck once it’s loaded though.
The UI is simple, including an overview.

At present, I’ve incorporated NVD and CWE search mechanisms that allow very granular filtering.

 As an example, using our favorite CVE-2008-0793, we can zoom in via the search field or the CVE ID drop down menu. Results are returned instantly from 76,123 total NVD entries at present.

From the CWE search you can opt to filter by keywords, such as XSS for this scenario, to find related entries. If you drop cross-site scripting in the search field, you can then filter further via the cwetitle filter field at the bottom of the UI. This is universal to this use of Shiny, and allows really granular results.

You can also get an idea of the number of vFeed entries per vulnerability category entities. I did drop CPEs as their number throws the chart off terribly and results in a bad visualization.

I’ll keep working on the vFeed Viewer so it becomes more useful and helps serve the vFeed community. It’s definitely a work in progress but I feel as if there’s some potential here.

Conslusion

Thanks to NJ for vFeed and all his work with the infosec tools community, if you’re going to Black Hat be certain to stop by Arsenal. Make use of vFeed as part of your vulnerability management practice and remember to check for updates regularly. It’s a great tool, and getting better all the time.
Ping me via email or Twitter if you have questions (russ at holisticinfosec dot org or @holisticinfosec).
Cheers…until next month.

Acknowledgements

Nabil (NJ) Ouchn (@toolswatch)

Continue reading toolsmith #116: vFeed & vFeed Viewer

toolsmith – Jay and Bob Strike Back: Data-Driven Security


Prerequisites
Data-Driven Security: Analysis, Visualization and Dashboards
R and RStudio as we’ll only focus on the R side of the discussion
All other dependencies for full interactive use of the book’s content are found in Tools You Will Need in the books Introduction.
Introduction
When last I referred you to a book as a tool we discussed TJ O’Connor’s Violent Python. I’ve since been knee deep in learning R and quickly discovered Data-Driven Security: Analysis, Visualization and Dashboards from Jay Jacobs and Bob Rudis, hereafter referred to a Jay and Bob (no, not these guys).
Jay and Silent Bob Strike Back 🙂
Just so you know whose company you’re actually keeping here Jay is a coauthor of Verizon Data Breach Investigation Reports and Bob Rudis was named one of the Top 25 Influencers in Information Security by Tripwire.
I was looking to make quick use of R as specific to my threat intelligence & engineering practice as it so capably helps make sense of excessive and oft confusing data. I will not torment you with another flagrant misuse of big data vendor marketing spew; yes, data is big, we get it, enough already. Thank goodness, the Internet of Things (IoT) is now the most abused, overhyped FUD-fest term. Yet, the reality is, when dealing with a lot of data, tools such as R and Python are indispensable particularly when trying to quantify the data and make sense of it. Most of you are likely familiar with Python but if you haven’t heard of R, it’s a scripting language for statistical data manipulation and analysis. There are a number of excellent books on R, but nowhere will you find a useful blending of R and Python to directly support your information security analysis practice as seen in Jay and Bob’s book. I pinged Jay and Bob for their perspective and Bob provided optimally:
“Believe it or not, we (and our readers) actually have ZeroAccess to thank for the existence of Data-Driven Security (the book, blog and podcast). We started collaborating on security data analysis & visualization projects just about a year before we began writing the book, and one of the more engaging efforts was when we went from a boatload of ZeroAccess latitude & longitude pairs (and only those pairs) to maps, statistics and even graph analyses. We kept getting feedback (both from observation and direct interaction) that there was a real lack of practical data analysis & visualization materials out there for security practitioners and the domain-specific, vendor-provided tools were and are still quite lacking. It was our hope that we could help significantly enhance the capabilities and effectiveness of organizations by producing a security-centric guide to using modern, vendor-agnostic tools for analytics, a basic introduction to statistics and machine learning, the science behind effective visual communications and a look at how to build a great security data science team.
One area we discussed in the book, but is worth expanding on is how essential it is for information security professionals to get plugged-in to the broader “data science” community. Watching “breaker-oriented” RSS feeds/channels is great, but it’s equally as important to see what other disciplines are successfully using to gain new insights into tough problems and regularly tap into the wealth of detailed advice on how to communicate your messages as effectively as possible. There’s no need to reinvent the wheel or use yesterday’s techniques when trying to stop tomorrow’s threats.”
Well said, I’m a major advocate for the premise of moving threat intelligence beyond data brokering as Bob mentions. This books endeavors and provides the means with which to conduct security data science. According to Booz Allen’s The Field Guide to Data Science, “data science is a team sport.” While I’m biased, nowhere is that more true than the information security field. As you embark on the journey Data-Driven Security: Analysis, Visualization and Dashboards (referred to hereafter as DDSecBook) intends to take you on you’ll be provided with direction on all the tools you need, so we’ll not spend much time there and instead focus on the applied use of this rich content. I will be focusing solely on the R side of the discussion though as that is an area of heavy focus for me at present.  DDSecBook is described with the byline Uncover hidden patterns of data and respond with countermeasures. Awesome, let’s do just that.
Data-Driven Security
DDSecBook is laid out in such a manner as to allow even those with only basic coding or scripting (like me; I am the quintessential R script kiddie) to follow along and grow while reading and experimenting:
1.       The Journey to Data-Driven Security
2.       Building Your Analytics Toolbox: A Primer on Using R and Python for Security Analysis
3.       Learning the “Hello World” of Security Data Analysis
4.       Performing Exploratory Security Data Analysis
5.       From Maps to Regression
6.       Visualizing Security Data
7.       Learning from Security Breaches
8.       Breaking Up with Your Relational Database
9.       Demystifying Machine Learning
10.   Designing Effective Security Dashboards
11.   Building Interactive Security Visualizations
12.   Moving Toward Data-Driven Security
For demonstrative purposes of making quick use of the capabilities described, I’ll focus our attention on chapters 4 and 6. As a longtime visualization practitioner I nearly flipped out when I realized what I’d been missing in R, so chapters 4 and 6 struck close to home for me. DDSecBook includes code downloads for each chapter and the related data so you can and should play along as you read. Additionally, just to keep things timely and relevant, I’ll apply some of the techniques described in DDSecBook to current data of interest to me so you can see how repeatable and useful these methods really are.
Performing Exploratory Security Data Analysis
Before you make use of DDSecBook, if you’re unfamiliar with R, you should read An Introduction to R, Notes on R: A Programming Environment for DataAnalysis and Graphics and run through Appendix A. This will provide at least an inkling of the power at your fingertips.
This chapter introduces concepts specific to dissecting IP addresses including their representation, conversion to and from 32-bit integers, segmenting, grouping, and locating, all of which leads to augmenting IP address data with the likes of IANA data. This is invaluable when reviewing datasets such as the AlienVault reputation data, mentioned at length in Chapter 3, and available as updated hourly.
We’ll jump ahead here to Visualizing Your Firewall Data (Listing 4-16) as it provides a great example of taking methods described in the book and applying it immediately to yourdata. I’m going to set you up for instant success but you will have to work for it a bit. The script we’re about to discuss takes a number of dependencies created earlier in the chapter; I’ll meet them in the script for you (you can download it from my site), but only if you promise to buy this book and work though all prior exercises for yourself. Trust me, it’s well worth it. Here’s the primary snippet of the script, starting at line 293 after all the dependencies are met. What I’ve changed most importantly is the ability to measure an IP list against the very latest AlienVault reputation data. Note, I found a bit of a bug here that you’ll need to update per the DDSecBook blog. This is otherwise all taken directly ch04.r in the code download with specific attention to Listing 4-16 as seen in Figure 2.
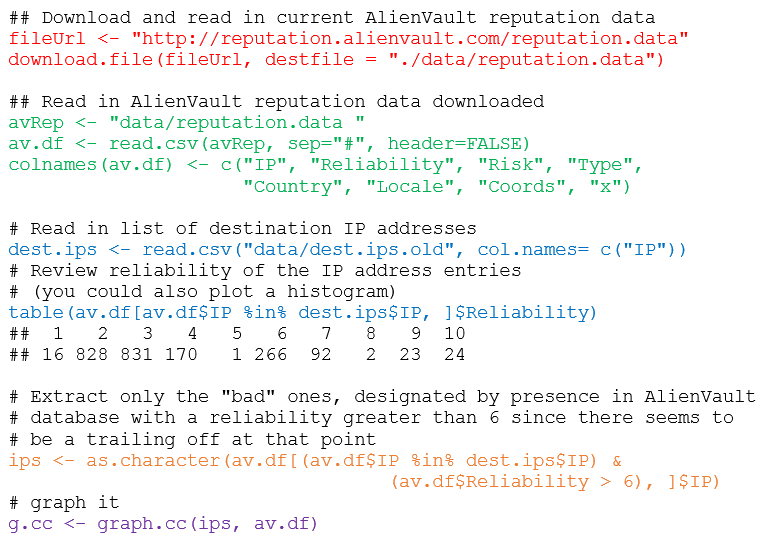
FIGURE 2: R code to match bad IPs to AlienVault reputation data
I’ve color coded each section to give you a quick walk-through of what’s happening.
1)      Defines the URL from which to download the AlienVault reputation data and provides a specific destination to download it to.
2)      Reads in the AlienVault reputation data, creates a data framefrom the data and provides appropriate column names. If you wanted to read the top of that data from the data frame, using head(av.df, 10) would result in Figure 3.
FIGURE 3: The top ten entries in the Alien Vault data frame
3)      Reads in the list of destination IP addresses, from a firewall log list as an example, and compares it against matches on the reliability column from the AlienVault reputation data.
4)      Reduces the dataset down to only matches for reliability above a rating of 6 as lower tends to be noise and of less value.
5)      Produces a graph with the graph.cc function created earlier in the ch04.r code listing.
The results are seen in Figure 4 where I mapped against the Alien Vault reputation data provided with the chapter 4 download versus brand new AlienVault data as of 25 AUG 2014.
FIGURE 4: Bad IPs mapped against Alien Vault reputation data by type and country
What changed, you ask? The IP list provided with chapter 4 data is also a bit dated (over a year now) and has likely been cleaned up and is no longer of ill repute. When I ran a list 6100 IPs I had that were allegedly spammers, only two were identified as bad, one a scanning host, the other for malware distribution. 
Great stuff, right? You just made useful, visual sense of otherwise clunky data, in a manner that even a C-level executive could understand. 🙂
Another example the follows the standard set in Chapter 6 comes directly from a project I’m currently working on. It matches the principles of said chapter as built from a quote from Colin Ware regarding information visualization:
“The human visual system is a pattern seeker of enormous power and subtlety. The eye and the visual cortex of the brain form a massively parallel processor that provides the highest bandwidth channel into human cognitive centers.”
Yeah, baby, plug me into the Matrix! Jay and Bob paraphrase Colin to describe the advantages of data visualization:
·         Data visualizations communicate complexity quickly.
·         Data visualizations enable recognition of latent patterns.
·         Data visualizations enable quality control on the data.
·         Data visualizations can serve as a muse.
To that end, our example.
I was originally receiving data for a particular pet peeve of mine (excessively permissive open SMB shares populated with sensitive data) in the form of a single Excel workbook with data for specific dates created as individual worksheets (tabs). My original solution was to save each worksheet as individual CSVs then use the read.csv function to parse each CSV individually for R visualization. Highly inefficient given the like of the XLConnect library that allows you to process the workbook and its individual worksheets without manipulating the source file.
Before:
raw ->
h ->
s ->
After:
sharestats ->
sheet1 ->
h1 ->
s1 ->
The first column of the data represented the number of hosts with open shares specific to a business unit, the second column represented the number of shares specific to that same host. I was interested in using R to capture a total number of hosts with open shares and the total number of open shares over all and visualize in order to show trending over time. I can’t share the source data with you as its proprietary, but I’ve hosted the R code for you. You’ll need to set your own working directory and the name and the path of the workbook you’d like to load. You’ll also need to define variables based on your column names. The result of my effort is seen in Figure 5.
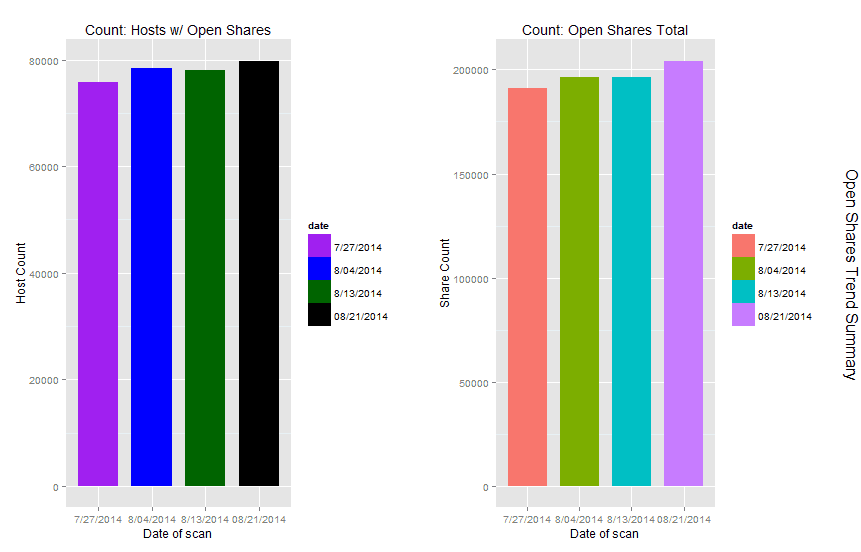
FIGURE 5: Open shares host and shares counts trending over time
As you can see, I clearly have a trending problem, up versus down is not good in this scenario.
While this is a simple example given my terrible noob R skills, there is a vast green field of opportunity using R and Python to manipulate data in such fashion. I can’t insist enough that you give it a try.
In Conclusion
Don’t be intimidated by what you see in the way of code while reading DDSecBook. Grab R and R Studio, download the sample sets, open the book and play along while you read. I also grabbed three other R books to help me learn including The R Cookbookby Paul Teeter, R for Everyone by Jared Lander, and The Art of R Programming by Normal Matloff. There are of course many others to choose from. Force yourself out of your comfort zone if you’re not a programmer, add R to your list if you are, and above all else, as a security practitioner make immediate use of the techniques, tactics, and procedures inherent to Jay and Bob’s most excellent Data-Driven Security: Analysis, Visualization and Dashboards.
Ping me via email if you have questions (russ at holisticinfosec dot org).
Cheers…until next month.
Acknowledgements

Bob Rudis, @hrbrmstr, DDSecBook co-author, for his contributions to this content and the quick bug fix, and Jay Jacobs, @jayjacobs, DDSecBook co-author.

Continue reading toolsmith – Jay and Bob Strike Back: Data-Driven Security