With DroneDeploy’s Fieldscanner, pilots can create maps as they fly
 Flying drones to inspect a farm, construction site, or any other venue from overhead can generate a huge amount of data. It takes time, though, for drone users to upload and turn this high-resolution data into maps, graphs or business intelligence they can act upon. Today, a data management platform for drones called DroneDeploy, is launching a tool called Fieldscanner that makes it possible… Read More
 Continue reading With DroneDeploy’s Fieldscanner, pilots can create maps as they fly
 Data visualization has been done — we have publicly traded, interactive, real-time and heck even artificially intelligent companies promising data visualization. But despite all the noise, Portland-based Reflect is making a go of it in the space, opening up its public beta today. By putting developers first and letting them integrate and customize visualizations in their own…
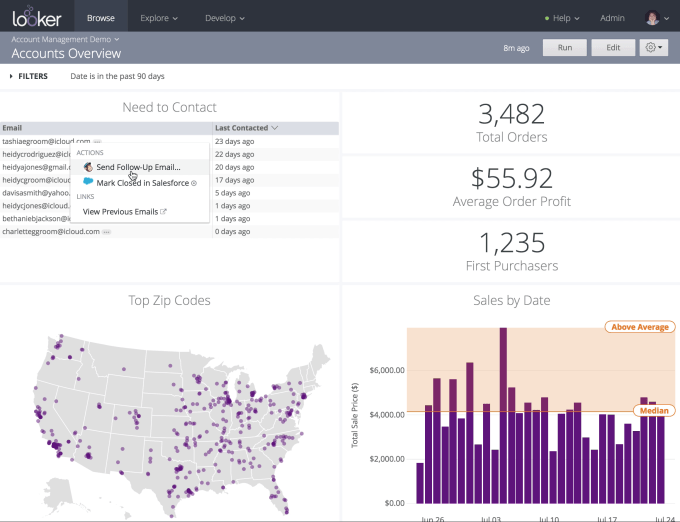
  The application is where we traditionally tend to work with a piece of software, but with the increasing use of APIs, sometimes the application is just one way of interacting with the tool. Looker announced version 4 of its data visualization tool today with expanded ways to make use of the data beyond the interface itself.
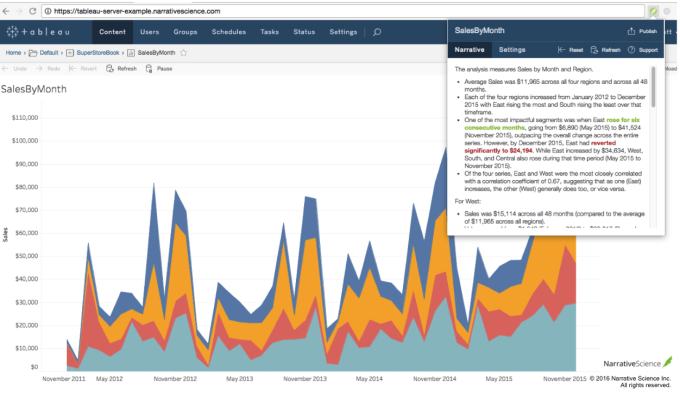
 Tableau Software‘s shares soared 13 percent on Tuesday following the announcement that the data analytics provider has partnered with Narrative Science, a Chicago-based company that develops natural language generation (NLG) tools. The result of the partnership is Narratives for Tableau, a free Chrome extension that automatically creates written explanations for Tableau…
  Looker, a data visualization and business intelligence startup announced a new component today that brings Looker data directly into Slack conversations without having to access the program separately. The new tool is called Looker Slack Bot and is built using the Slack bot technology. It provides a way for users working in Slack to access data related to the discussion. They may want a…